Southeastern Michigan Communities Working to Fund Pension Systems

In 2017 the Protecting Local Government Retirement and Benefits Act was passed, with the goal of identifying the systems that are underfunded. According to the State of Michigan, a retirement fund is underfunded if less than 60 percent of the fund is funded, and there is an annual required contribution that is over 10 percent of governmental fund revenues. While 60 percent is the current threshold, there are discussions that eventually that number will continue to increase to 100 percent to more accurately reflect the funded status of a retirement plan. There are also thresholds that determine if a local government entity has an underfunded retiree health care system, an issue we will explore next week.

Currently, in the State of Michigan local government entities are facing, in total, over $18 billion in unfunded liabilities for retirement and retiree healthcare funds, according to the Reason Foundation. This foundation worked with the State of Michigan to develop the Protecting Local Government Retirement and Benefits Act and the reporting system that goes along with it.

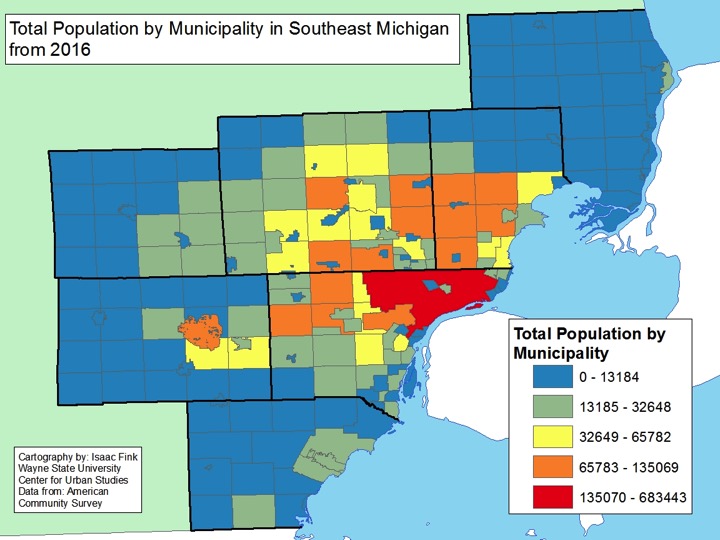
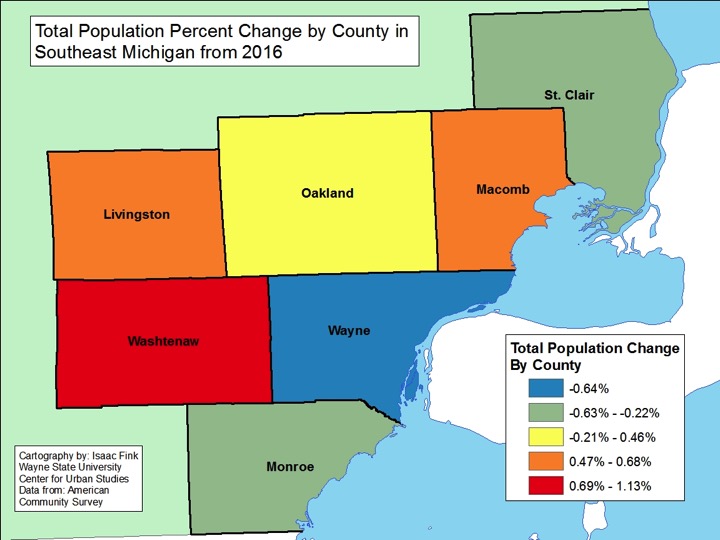
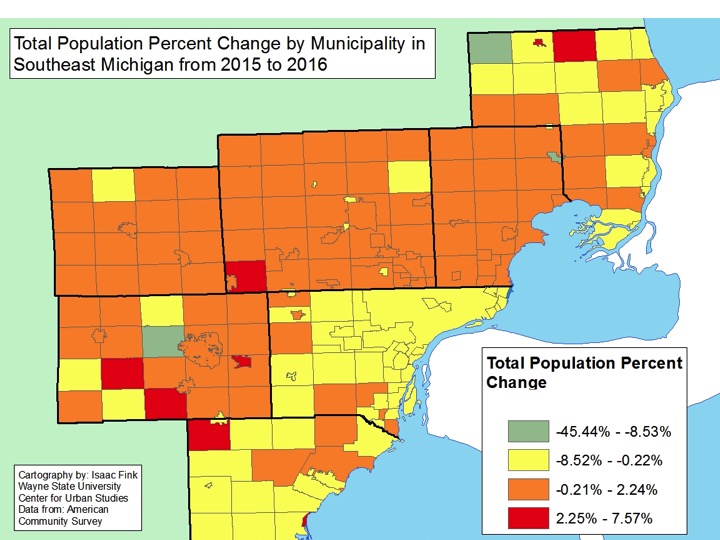
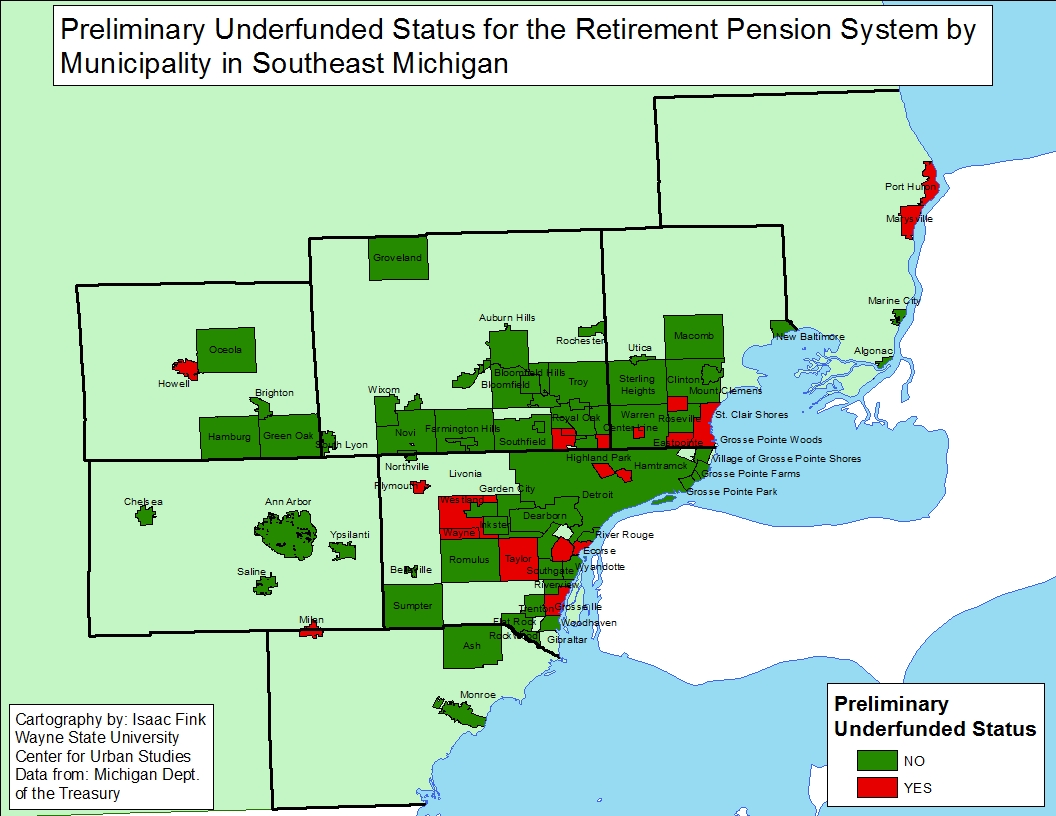
The maps below provide details on what local government retirement plans are preliminary funded or underfunded in Southeastern Michigan, as determined by the Michigan Department of Treasury through implementation of the Protecting Local Government Retirement and Benefits Act. These are deemed preliminary due to the fact the new oversight body for determining funded, unfunded and waiver status must still review information submitted. Note, information is not displayed for all local government units in the region because not all units had provided their funding as of June 9, 2018. Additionally, some local government units beyond cities and townships are included in the data provided by the State, such as public safety retirement funds.

Of the 183 local government entities (this includes multiple funds for one municipality) that submitted their retirement funding information to the State for the Southeastern Michigan region, 37 of them were reported as having an underfunded status, or less than 60 percent of the retirement fund being funded. Of those that were reported as being underfunded, the majority of them had 45 percent or more the entity’s retirement system funded. However, there were five entities with 25 percent or less of the retirement system funded. These entities were:

  • Capac (St. Clair County): 24.2%
  • Highland Park General Employee fund: 2%
  • Highland Park Public Safety Fund: 3.7%
  • Highland Park Police and Fire Fund: 6.8%
  • Taylor City Housing Commission Authority: 0%

It should be noted that while the City of Taylor’s Housing Commission Authority retirement fund is underfunded, the City of Taylor’s general employee and police and fire retirement funds met State guidelines to be determined funded.

As part of the newly adopted State legislation related to retirement and retiree health care plans a Municipal Stability Board was created to review the corrective plans that underfunded entities must create and submit to the State. This board is housed under the Michigan Department of Treasury is made up of three individuals appointed by the governor. Corrective plans must be developed and submitted within 180 days of the State determining an entity’s retirement system is underfunded.


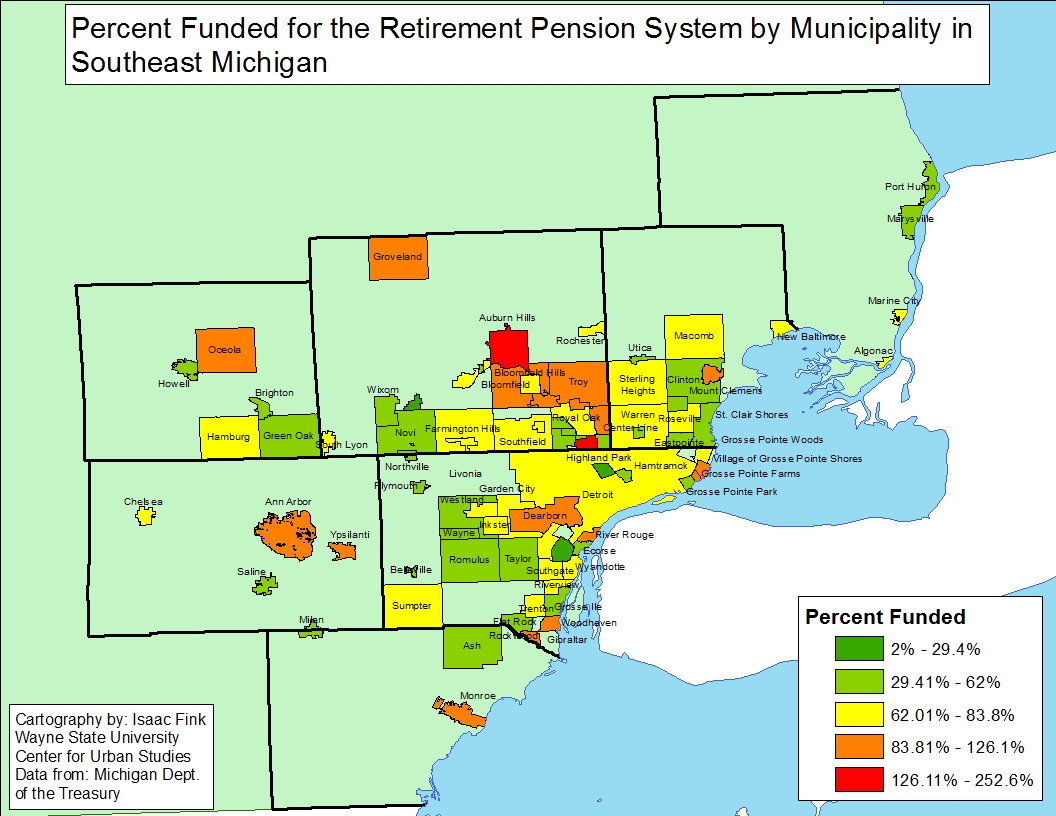
On the opposite side of the spectrum, while there were far more local government entities that were determined have funded retirement systems, than not, there were several that were more than 100 percent funded. The entities with the highest percentage of funding for their retirement funds were:

  • City of Ferndale (General Employees): 253%
  • City of Dearborn (Chapter 24): 239%
  • City of Pontiac (General Employees); 176%
  • City of Ypsilanti (General Employees) 126%
  • City of Grosse Pointe: 119%
  • City of Troy: 117%
  • Lima Township: 112%
  • City of Grosse Pointe Farms: 111%
  • City of Gibraltar (General Employees): 106%
  • City of Dearborn (General Employees): 104.3%
  • City of Mt. Clemens: 103%
  • Oakland County: 103%
  • City of Gibraltar (Public Safety): 102%
  • Groveland Township: 101%

Funding of retirement plans is vital for all local government entities as underfunded plans can lead to long-term financial troubles for a government entity, not excluding bankruptcy. Additionally, underfunded plans can also affect recruitment and retention of employees.

Unemployment Rates in Detroit,Region Take Recent Drop, Higher Than Previous Year

  • The unemployment rate decreased in Detroit and at the state level(monthly);
  • Regionally, April 2018 unemployment rates are higher than the prior year;
  • Housing prices continue to rise in Metro-Detroit.

In April of 2018 the unemployment rate for the State of Michigan was 4, a decrease from the March unemployment rate of 4.6, according to the most recent data provided by the Michigan Department of Technology, Management and Budget. The State unemployment rate for April was 0.3 point above what it was in April of 2017.

The Detroit rate was 1.3 points lower in April of 2018 than in March. In April of 2018 Detroit’s unemployment rate was reported to be 7.4, this was .3 points higher than in April of 2017.

The chart above displays the unemployment rates for each of the seven counties in Southeastern Michigan for April of 2017 and 2018. Monroe County was the only one in the seven county region to have a lower unemployment rate in 2018 than in 2017. In April of 2017 Monroe County’s unemployment rate was 3.7 and in 2018 in dropped slightly to 3.7.

In April of 2018 Wayne County had the highest unemployment rate at 4.3, St. Clair County was only slightly below at 4.2. These two counties were the only two in the region to have unemployment rates about 3.5 in April of 2018. Washtenaw County had the lowest unemployment rate in the region at 2.8. Oakland County and Livingston County were the only other two counties in the region with an unemployment rate below 3.

While Livingston County had among the lowest unemployment rate in the region in April of 2018 it also had the largest increase in its unemployment rate between April 2017 and April 2018. In April 2017 the unemployment rate for Livingston County was 2.4 and in 2018 it increased to 2.9.

The above chart shows the Standard and Poor’s Case-Shiller Home Price Index for the Detroit Metropolitan Statistical Area. The index includes the price for homes that have sold but does not include the price of new home construction, condos, or homes that have been remodeled.

According to the index, the average price of single-family dwellings sold in Metro Detroit was $120,020 in March 2018; this was $1,220 higher than the average family dwelling price in February. The March 2018 price was an increase of $16,240 from March of 2016 and an increase of $22,120 from March of 2015 and an increase of $26,240 from March of 2014.

Evictions Highest in Detroit, Inner-Suburbs

In 2016, the City of Harper Woods just northeast of Detroit, had the highest eviction rate in Southeastern Michigan, according to Eviction Lab. Eviction Lab is a nationwide data base created by Princeton University that shows formal evictions that have taken place throughout the country; these formal evictions are ones that occurred through the court system. In Harper Woods, the eviction rate was 9.9 percent per 100 rental units; this was equivalent to 175 formal evictions in 2016. The City of Dearborn Heights, which is just west of the City of Detroit, had an eviction rate of 9.82 percent per 100 rental units, which was equivalent to 502 total evictions.

The Top 5 Eviction Rates (per 100 rental units) in Southeastern Michigan by City were:

  • Harper Woods: 9.9
  • Dearborn Heights: 9.82
  • Bellevue 9.44
  • Ecorse: 9.29
  • Inkster: 8.18

No data was available for the townships in the above map with the very light green.

While inner-ring suburbs ranked the highest for eviction rates in Southeastern Michigan, the City of Detroit had the most evictions in terms of sheer volume. In total, there were 6,664 formal evictions in the City of Detroit in 2016; this was equivalent to an eviction rate of 5.2 percent per 100 rental units.

When examining eviction rates at a Census Tract level in Detroit, the data shows that there were only four Census Tracts with eviction rates above 11 percent. Two of these Census Tracts were located on the City’s west side and the other two were located on the far east side of the City. The majority of the central part of Detroit, and into Southwest Detroit, did not have formal eviction rates above 5.3 percent in 2016, according to the data. The west of the City had the highest concentration of formal eviction rates above 7.7 percent.

Understanding eviction rates for the City of Detroit, and the region, is important because this data further demonstrates how income inequality affects the citizens of Southeastern Michigan. Evictions occur when a rental tenant is involuntary removed from his or her home. Evictions can occur due to the tenant’s inability to pay rent, along with reasons such as property damage and taking on boarders. Clearly though, there is a relationship between income and evictions. For low-income families, a single monetary emergency can mean a missed rent payment, and ultimately eviction. As can be seen in the first map, many of the cities in Southeastern Michigan with a 0 percent eviction rate are those with higher than average median incomes, such as Bloomfield Hills and Birmingham. Detroit, Ecorse and Inkster are among the cities in Southeastern Michigan that do not have such socioeconomic characteristics. Rather, Detroit, Ecorse and Inkster have among the lowest median incomes in the region and some of the highest eviction and poverty rates.

This discussion on eviction rates will certainly be part of our overall poverty review of Southeastern Michigan, which will also examine median incomes, poverty rates, homeowner status and education levels.

To understand the dynamics and consequences of eviction for the poor, see: Evicted: Poverty and Profit in the American City by Matthew Desmond.


Union Membership in Michigan Increases

  • The unemployment rate increased at the state level, minimally, and decreased in Detroit (monthly);
  • Union membership in Michigan increased between 2016-2017;
  • Regionally, Washtenaw County’s unemployment rate was the lowest;
  • Housing prices slightly decreased from November to December.

In February of 2018 the unemployment rate for the State of Michigan was 5.2, a slight decrease from the January unemployment rate of 5.3, according to the most recent data provided by the Michigan Department of Technology, Management and Budget. The State unemployment rate for February was 0.1 point below what it was in February of 2017.

The Detroit rate was 2.5 points lower in February of 2018 than in February of 2017. In February of 2018 Detroit’s unemployment rate was reported to be 9.5, this was 0.4 points lower than the month before.

The chart above displays the unemployment rates for each of the seven counties in Southeastern Michigan for February of 2017 and 2018. St. Clair County had the highest unemployment rates for both 2017 and 2018 (6.4 and 5.7 percent, respectively). Washtenaw County had the lowest unemployment rates in 2017 and 2018 during the month of February; Oakland County also had the lowest unemployment rate in the region in 2018. In February 2018 the Washtenaw County and Oakland County unemployment rates were 3.6. In 2017, the unemployment rate in Washtenaw County was also 3.6, meaning there was no change from one year to the next. Monroe County’s unemployment rate also remained unchanged between 2017 and 2018; for both years it was reported to be 5.3.

Wayne and St. Clair counties were the only two in the region with unemployment rates above at or above 5.5 in February of 2018. These two counties also had the largest unemployment decreases between February of 2017 and February of 2018. The decrease was 0.7 for both counties. All counties experienced a decrease in unemployment rates, except for those where the rates remained unchanged.

The percentage of the employed workforce with membership in a union increased between 2016 and 2017 in the State of Michigan, according to the Bureau of Labor Statistics. According to the data, 15.6 percent of the employed workforce were members of a union in 2017; in 2016 that number was 14.4. With 15.6 percent of the employed workforce being members of a union, that equated to 658,000 employees; in 2016 606,000 employees were members of a union.

While the total number of union members has fluctuated over the last five years, there has been a significant decrease in the total number of union members since 2007. In 2007, according to the data, there were 819,000 union members, and by 2017 that number decreased to 658,000. The total percentage of the employed workforce that were members of a union was 19.5 percent in 2007. Again, the percentage that was members in 2017 was 15.6.

The above chart shows the Standard and Poor’s Case-Shiller Home Price Index for the Detroit Metropolitan Statistical Area. The index includes the price for homes that have sold but does not include the price of new home construction, condos, or homes that have been remodeled.

According to the index, the average price of single-family dwellings sold in Metro Detroit was $117,340 in December 2017; this was $210 lower than the average family dwelling price in November. The December 2017 price was an increase of $7,220 from December of 2016 and an increase of $13,570 from December of 2015 and an increase of $20,360 from December of 2014.

Detroit’s Outer Most Neighborhoods Have Lowest Percentage of Long-Term Homeowners

Of the about 600 Census Tracts in the City of Detroit about 75 of them have more than 40 percent of the residents who have owned their home since 1979 or earlier, according to the most recent data from U.S. Census Bureau. These Census Tracts are primarily located just west of Highland Park, but not in the City’s most westward neighborhoods. There are also several Census Tracts with a high percentage of long-term homeowners just east of Hamtramck. Again though, these neighborhoods don’t extend to the most eastern parts of the City. Homeownership in the Census tracts along the City’s borders primarily peaked between 1990 and 1999, with between 20 and 43 percent of the homeowners in those Census tracts having owned their homes since that decade. Between 2000 and 2009 there was about a handful of Census tracts where between about 50 and 80 percent of homeowners moved in during that decade. One of those Census tracts is located in Southwest Detroit right along the Detroit River. There is also about a handful of Census tracts with 10-25 percent of homeowners having just purchased their home since 2015. The Census Tracts are located in the Corktown, Midtown, North End, Palmer Park and West Village areas, all areas experiencing improvement in housing quality and investment.

There are large areas of Detroit’s outer neighborhoods where large shares of the renters have moved in since 2010. Detroit’s most eastern and western neighborhoods have among the highest percentage of renters who moved into those areas between 2010 and 2014. The City Airport/Kettering neighborhood areas have majority of renters residing in those areas since the early 2000s. The “Poletown” neighborhood just south of Hamtramck has the highest percentage of recent home renters between 2010 and 2014. Higher percentage of recent renters can arguably be attributed to three trends, the first being the increase of people moving into Detroit’s re-developing neighborhoods (Downtown, Midtown, New Center, the West Village-in these areas between 60-90 percent of renters have been there since 2010). The second trend may be the movement of lower income individuals due to evictions and/or inability to afford long-term housing options. The third trend, frequently mentioned by property inspectors and others, is families forced by eviction to become renters of the homes they formerly owned. There are only two Census Tracts in Detroit where more than 20 percent of residents have been renting since 1979 or earlier, one is located just north of Hamtramck, and the other is located near the Woodbridge area. In the vast majority of City Census Tracts it is rare to find substantial percentages of renters remaining in one spot for longer than 35 plus years.

Overall, the data in this post shows that City’s outermost neighborhoods have the lowest percentage of long-term homeowners, and instead higher percentages of recent renters. Next week we will look at how income plays a role in homeowner and rental markets in Detroit.


Number of Robots Increasing, But Not Unemployment Rates

The data we’ve presented on robots in Michigan are clear. Their numbers are increasing. And the interpretation of those numbers by some economists are also clear. A recent Detroit Free Press article, on a Brookings study says that M.I.T and Boston University researchers currently estimate that the addition of one robot per 1,000 workers leads to the unemployment of up to six workers. So, unemployment might be going up as robots increase? But no.

While the number of industrial robots in use has increased throughout the State of Michigan between 2010 and 2015 the unemployment rates for the affected Metropolitan Statistical Area’s (MSA) have not. For example, in the Battle Creek MSA the Brookings Institute Analysis of International Federation of Robotics Data found there were about 17 industrial robots per 1,000 workers in 2015, this equated to a total of about 840 industrial robots in use in the Battle Creek area in 2015. Also, in 2015 the unemployment rate for the Battle Creek MSA was 5.1 and in 2010 the unemployment rate for that area was 11.7. A substantial decrease.

In the Detroit Metropolitan area, the number of industrial robots in use has nearly tripled since from 5,752 in 2010 to 15,115 in 2015. If each robot is worth more than one job as the economist projects, then that would mean a lot of unemployed people. But the unemployment rate fell from 13.9 in 2010 to 5.9 in 2015. According to the Michigan Department of Management, Technology and Budget none of the State’s 14
MSA’s experienced an increase in the unemployment rates between 2010 and 2015. So, more robots, but a decrease in unemployment? Well, maybe, but some might say we’re mixing up a macro trend—the overall
expansion of the economy since the 2008 recession—with a more micro process—the increase in the number of robots, which would not have so large an effect as to decrease overall unemployment. There still might be an effect, but at a lower level. And it might be consistent with recent findings from University of
Michigan economists who are indicating that the expansion has brought back only about 73 percent of the jobs lost in the recession.

Where are the other 27 percent? Robots and offshore, perhaps?


February Economic Indicators: Unemployment Rates, Housing Costs Fairly Stable


  • The unemployment rate increased at the state and local levels(monthly);
  • Regionally, Washtenaw County’s unemployment rate was the lowest;
  • The number of demolitions in Detroit outweighed the number of building starts;
  • Housing prices remained flat.

In December of 2017 the unemployment rate for the State of Michigan was 4.7, a slight increase from the November unemployment rate of 4.6, according to the most recent data provided by the Michigan Department of Technology, Management and Budget. The State unemployment rate for December was 0.3 points below what it was in December of 2016.

The Detroit rate was lower over the last year, but up for the most recently reported month. The City of Detroit unemployment rate was reported to be 1.1 points lower in December of 2017 than what it was reported at in December of 2016. For December 2017 the unemployment rate was reported at 8.7; in 2016 it was reported to be 9.8. Between November and December of 2017 though the unemployment rate for Detroit increased by 0.9 points.

The chart above displays the unemployment rates for each of the seven counties in Southeastern Michigan for December of 2016 and 2017. Wayne County had the highest unemployment rates for both 2016 and 2017 (5.7 and 5.1 percent, respectively). Washtenaw County had the lowest unemployment rates in 2017 and 2016 during the month of December. In December 2017 the Washtenaw County employment rate was 3 and in 2016 it was 2.7. Additionally, in December of 2017, Washtenaw and Monroe counties were the only two in the region that had unemployment rates higher than in December of 2016.

Wayne and St. Clair counties were the only two in the region with unemployment rates above 4.5 percent in 2017.

St. Clair County had the largest unemployment rate decrease between December 2016 and 2017 at 0.8. In December of 2017 St. Clair County had a unemployment rate of 4.8, and in 2016 that rate was 5.6.

Oakland County had the highest number of housing starts in 2017, according to the Southeastern Michigan Council of Governments, at 3,467. St. Clair County had the lowest number of housing starts in the region at 307, more than 3,000 less than Oakland County.

Macomb, Oakland and Wayne counties had the highest number of housing starts in 2017; these counties also have the highest population numbers in the region. Additionally, all three counties have experienced growth in the number of housing permits being pulled since 2010. Macomb and Oakland counties did experience a dip of about 400 each in 2014, but numbers continued to grow after this.

Wayne County was the only one in the region that had a higher number of demolitions than housing starts. All but 206 of 3,415 demolitions occurred in the City of Detroit, according to SEMCOG. In total, there were 3,209 demolitions in Detroit in 2017 and 1,084 housing starts in the same year.

Below is a map of all the demolitions in Detroit between Jan. 1 and Feb. 22, 2018. So far this year there has been 176 demolitions in Detroit, according to the City’s open data portal. The map shows that the demolitions are now occurring outside of the downtown/Midtown areas and instead farther out into the City. Some of the heaviest concentrations of demolitions are occurring in the West Village area of the City and in the far northwest area.

The above chart shows the Standard and Poor’s Case-Shiller Home Price Index for the Detroit Metropolitan Statistical Area. The index includes the price for homes that have sold but does not include the price of new home construction, condos, or homes that have been remodeled.

According to the index, the average price of single-family dwellings sold in Metro Detroit was $117,550 in November 2017; this was $300 lower than the average family dwelling price in October. The November 2017 price was an increase of $8,230 from November of 2016 and an increase of $14,140 from November of 2015 and an increase of $20,260 from November of 2014.

Healthcare, Technology, Business Expected to Add Most Jobs in Detroit

News recently broke that the City of Detroit did not make the short list as a possible location for the second Amazon Headquarters. The reason why? Some said it was concern over the region’s ability to attract talent in a sustainable and long-term way and lack of a robust transit system. While Amazon may not be moving to Detroit, this post highlights what talent the Metro-Detroit Region is expected to foster through 2024.

The data in this post is from the Michigan Department of Technology, Management and Budget and highlights what industries and occupations that Department predicts will grow and lose positions between 2014 and 2024 in the Detroit Metro area.

The data below shows expected growth rates, by percentage and numbers, for all the major industries. According to the data, the construction industry is expected to the experience the overall largest growth rate in the Metro-Detroit region at 14 percent. When digging deeper into the data we see that the sub-industries of heavy civil engineering construction and specialty trade contractors had among the highest projected growth rates at 23.1 percent and 12.5 percent, respectively (see Chart 2).   The professional and business services industry is projected to have the second highest growth rate at 13 percent. This growth is largely supported by the 17.2 percent growth rate projected for the professional, technical and scientific sub-industry, which is categorized under professional business services. Just as heavy civil engineering construction ranked atop the projected growth list for the sub-industries, the professional, technical and scientific sub-industry ranked second (see Chart 2).

When examining the raw numbers, professional and business services is expected to add the largest number of industry jobs at about 48,000. The professional, technical and scientific sub-industry makes up about 32,000 of these positions. As shown in Chart 3 though, professional, technical and scientific sub-industry ranks second when examining the numbers, the health care and social assistance industry ranks at the top with an anticipated number of about 33,000 positions to be added.

The only major industry in the region that is expected to experience a loss is government. The data projects a 3 percent loss of positions between 2014 and 2024. When looking at the sub-industry data we see that that loss is anticipated to come from the federal government side, as highlighted in the Chart 3. The Postal Service is expected to experience a 21.1 percent loss, or about 2,000 jobs, and the federal government is expected experience a 3.5 percent loss, or about 2,600 jobs (see Chart 5). The only government sub-industry that is projected to experience growth between 2014 and 2024 is local government; this sub-industry is expected to have a 2.2 percent growth rate.

In addition to examining industry growth in Metro-Detroit we are also looking into occupational growth. The first chart below, Chart 4, shows the projected percentage growth, or decline, of each major industry as defined by the the Michigan Department of Technology, Management and Budget. The Computer and Mathematical Occupations has the highest projected rate of growth at about 18 percent and among the highest number of anticipated jobs to be added at about 11,600 (Chart 6).

The Healthcare Support Occupations has the second highest anticipated growth rate at 16 percent, but it is the Healthcare Practitioners Occupation that is expected to add the most number of positions, as shown in Chart 7, at 12,785. For the Computer and Mathematical Occupations category, the sub-occupations of Statistician and Operations Research Analyst ranked among the highest for project growth at 41 and 37 percent, respectively, but combined these two occupations are expected to add a total of 470 jobs. As shown in Chart 9, Mechanical Engineers (5,280), Home Health Aides (4,815) and Customer Service Representatives (4,735) are the top three sub-occupations expected to add the highest number of positions between 2014 and 2024 (the number of positions expected to be added through sub-occupations combined are the total number of positions expected to be added to the occupation categories).

The sub-occupation that ranked highest for expected rate of growth was credit councilor, which has a projected growth rate of 41.7 percent, as shown in Chart 8. Credit Councilors fall under the Business and Financial Operations Occupation and are expected to add 340 jobs.

The final two charts in this post show that the occupations with the largest anticipated rate of decline are those that are becoming obsolete, largely due to technology. For example, in Chart 9, the percentage of telephone operators needed between 2014 and 2024 is expected to decline by 48 percent and the percentage of photographic processors is expected to decline by 38 percent. When examining just the numbers, as shown in Chart 10, bookkeeping, accounting and auditing clerks are expected to lose the largest total number of positions at 1,245, followed by postal service mail carrier (900) and press machine setters and operators (840).

Overall, this data set shows that healthcare and business, including computer technologies, and construction are the industries expected to support predicted job growth in Metro-Detroit through 2024, with the occupations that support these industries expected to follow similar growth.

It is important that numbers versus percentages be paid attention to when understanding the economic future of Detroit, because, as our post shows, percentage of growth for certain occupations may be high but a further look at the numbers shows that the total number of positions currently available and expected to be offered in the future remain small in some of these categories with high percentage increases.

But, both the raw numbers and percentages for healthcare, business and computer and construction industries and occupations give some idea of the future of jobs in the Detroit area over the next six years.

Southeastern Michigan’s Population Slightly Increases, Auto Sales and Unemployment Decreases

  • Detroit and Wayne County suffered the loss of populations between 2015 and 2016, while some of the region’s outermost communities experienced growth;
  • The unemployment rate decreased at the State and local levels(monthly);
  • Regionally, Livingston County’s unemployment rate remains the lowest;
  • The Standard and Poor’s Case-Shiller Home Price Index for the Detroit Metropolitan Statistical Area shows home prices continue to increase monthly and annually while national mortgage rates are became higher than those throughout the State and the City of Detroit.
  • Auto sales took a dip between 2016 and 2017, while employment in auto manufacturing increased

The City of Detroit remained the most populated City in Michigan, according to 2016 Census data. However, Detroit’s population numbers continued to decline. In 2016, it was reported that the City of Detroit had a population of 683,443 and in 2015 the population was at 690,074. This 6,631 person population loss was equivalent to nearly a 1 percent loss in population. Aside from Detroit remaining as the most populated city regionally, and statewide, the other four of the top five most populated cities in Southeastern Michigan were: Warren (135,069), Sterling Heights (131,674), Ann Arbor (118,087) and Clinton Township (99,193). Of all the five communities, Detroit was the only City to lose residents. Of the 210 communities for which data was available was available for, 98 lost residents between 2015 and 2016.

Overall, while population gain, and loss, between cities wasn’t extreme, the trend of some of the region’s most rural communities growing continued. For example, Greenwood Township in St. Clair County grew by about 800 people, which was about an 8 percent increase. In terms of percent change, the top 10 communities that experienced growth, ranging from percent change increases of 5.8 to 1.8 percent, were all located outside of the region’s urban centers, with the exception of Ypsilanti. This narrative is further strengthened by the fact that, at the County level, four counties that grew in population between 2015 and 2016. Those four were Oakland, Washtenaw, Livingston and Macomb counties. As the map shows, majority of the communities in these counties experienced no more than a 0.21 population loss, if a loss occurred at all. In terms of percent change, Washtenaw County grew the most at 1.13 percent, which was equivalent to an additional about 4,000 people calling Washtenaw County home. Conversely, Wayne County experienced the greatest population loss in the county at -0.64 percent, which was equivalent to about a 11, 375 people leaving the county between 2015 and 2016. Despite the population loss, Wayne County remains the most populated county in the region with 1,767,593 residents.

When examining the bigger picture, the data shows that, as a whole, Southeastern Michigan grew by about 3,700 residents between 2015 and 2016. In 2016 there were 4,716,448 residents and in 2015 there were 4,712,709.

In November of 2017 the unemployment rate for the State of Michigan was 4.6, a slight increase from the October unemployment rate of 4.5, according to the most recent data provided by the Michigan Department of Technology, Management and Budget. The State unemployment rate for November was 0.3 points below what it was in November of 2016.

The City of Detroit unemployment rate was reported to be 2.6 points lower in November of 2017 than what it was reported at in November of 2016. For November 2017 the unemployment rate was reported at 7.8; in 2016 it was reported to be 10.4.

The chart above displays the unemployment rates for each of the seven counties in Southeastern Michigan for November of 2016 and 2017. Wayne County had the highest unemployment rates for both 2016 and 2017 (5.7 and 4.5 percent, respectively). In November of 2017, Livingston County had the lowest unemployment rate at 2.8 while Washtenaw County had the lowest rate in 2016 at 2.9. By November of 2017, Washtenaw County’s unemployment rate increased to 3.1. In November of 2017, Washtenaw and Monroe counties were the only two in the region that had unemployment rates higher than in November of 2016.

Wayne and St. Clair counties were the only two in the region with unemployment rates at or above 4 percent in 2017.

Wayne County had the largest unemployment rate decrease between November 2016 and 2017 at 1.3. In November of 2017 Wayne County had a unemployment rate of 4.5, and in 2016 that rate was 5.7.

Data on the national, state and local average 30-year mortgage interest rates show rates increasing across all three from September to December. These rates were provided by bankrate.com, which does a national survey of large lenders on a weekly basis. As a 30-year fixed rate mortgage is the most traditional form of home financing, we chose it to show the rate differences.

It was the national interest rate with the highest average for in December of 2017 at 4.09, which was 1.1 points higher than the last time we examined this data, which was in September of 2017 .

In December of 2017 Detroit’s average 30-year fixed mortgage interest rate was 4.03, a rate that was higher than the state average. It showed an increase after declining from March through September.

The above charts show the Standard and Poor’s Case-Shiller Home Price Index for the Detroit Metropolitan Statistical Area. The index includes the price for homes that have sold but does not include the price of new home construction, condos, or homes that have been remodeled.

According to the index, the average price of single-family dwellings sold in Metro Detroit was $117,850 in November 2017; this was $1,170 higher than the average family dwelling price in May. Also, the November 2017 price was an increase of $8,060 from June of 2016 and an increase of $14,440 from November of 2015 and an increase of $20,560 from November of 2014.

According to data from a recent Wall Street Journal article, overall year-to-date auto sales for the Ford Motor Company, General Motors and Chrysler all declined between 2016 and 2017. This data includes sales of domestic and import cars and trucks. Chrysler suffered the biggest hit, according to the data, with an 8.9 percent total decrease in sales. Ford suffered a .9 percent decrease in sales and General Motors suffered a 1.4 percent decrease.

Of all the automotive companies, American and international, General Motors had the largest percent of market share in 2017 at about 17 percent with about 3 million sales.

Between 2010 and 2017 employment in both the motor vehicle and motor vehicle parts manufacturing employment sectors has grown in the Detroit Metropolitan Statistical Area. In 2010 there were 45,100 employees in the motor vehicle employment manufacturing sector and 18,400 in the motor vehicle parts manufacturing sector for an over all total of 63,500. By 2017 there 71,500 employees in the motor vehicle manufacturing employment sector, a number that has steadily increased over the last eight years. For the motor vehicle parts manufacturing sector there were 27,100 employees. The total across both sectors in 2017 was 98,600. So, compared to 2010, these two have increased overall by 35,100, more than 50 percent. However, the rate of increase for vehicle manufacturing has slowed, while the rate for parts manufacturing has stabilized, after a slight drop.

Food Least Accessible for Detroit in Southeastern Michigan

Throughout Southeastern Michigan the City of Detroit had the highest number of Census tracts with the lowest access to food sources, according to 2015 data from the U.S. Department of Agriculture (USDA). For the purpose of this post, low income is defined as Census tracts with a poverty rate of 20 percent of higher or with a median family income less than 80 percent of median family income for the state or metropolitan area. Areas with low access to food are identified as Census tracts having 33 percent of the population living within a certain mileage from a grocery store. In this post these areas are identified by either being a half-mile or mile from a grocery store in an urban area and 10 miles in a rural area (these differences are identified in each map below). According to the USDA, none of the counties and/or Census tracts in Southeastern Michigan are identified as rural, so the 10 mile rural identifier will not be used in this post.

Half-mile  Mile

When examining the Southeastern Michigan region for the number of Census tracts with low-income families and low access to food sources within a half-mile majority of the City of Detroit is highlighted in the map below, in addition to Hamtramck and Highland Park. There were also several Census tracts just outside the border of Detroit, in areas including Warren, Eastpointe, Dearborn, Hazel Park and Southfield, that had low incomes and low access to reliable food sources. While there were several Census tracts in every one of the seven counties in the Southeastern Michigan region, it was Wayne County that had the had the highest number of residents with low incomes and low access to grocery stores within a half-mile of residents’ homes.

A closer look at just the Census tracts in the City of Detroit show that there were only a select number of pockets in the City that were not considered low income and also had access to a grocery store closer than a half-mile. One such area that stands out is the downtown area. Other areas include the Denby, Cody Rouge and West Village neighborhoods.

In Washtenaw County, it was the Ann Arbor/Ypsilanti area that had the highest number of Census tracts with low-income families not having access to grocery stores and in Oakland County, beyond those Census tracts that border Detroit, it was the Pontiac that had the most number of low-income residents with low access to food options. In the less densely populated counties in the region (Monroe, St. Clair, Livingston) there was an average of about three Census tracts with a poverty rate of 20 percent of higher or with a median family income less than 80 percent of median family income and access to a grocery store more than a half-mile away.

One Mile

When the radius was expanded to one mile, the number of Census tracts without access to grocery stores dramatically decreased. The most notable decrease in the region was in the City of Detroit. In the maps below there are only about 20 Census tracts in the City of Detroit with a poverty rate of 20 percent of higher or with a median family income less than 80 percent of median family income and access to a grocery store more than a mile away. In the maps above, which depict access within a half-mile, nearly the entire City is highlighted for low income and low access. A notable difference due to access between a half-mile and mile can also be seen in the Ypsilanti/Ann Arbor area.

Throughout Livingston, Monroe and St. Clair counties there was a minimum decrease in the number of Census tracts with a poverty rate of 20 percent of higher or with a median family income less than 80 percent of median family income and access to a grocery store more than a half-mile away.

Low Income and Low Vehicle Access

The maps below identify low-income Census tracts where more than 100 housing units did not have a vehicle and were more than a half-mile from the nearest grocery store. When applying these variables we see there was an overall fewer number of Census tracts without access than when only looking at access, despite transportation accessibility. This was particularly true throughout Wayne County and in Census tracts just north of Wayne County. In Detroit, the highest concentration of Census tracts with more than 100 housing units not having a vehicle and that were more than a half-mile from the nearest grocery store were those on the west side of the City along Livernois Avenue.

In examining the data provided by the USDA, we see that regionally it was the City of Detroit, its inner-ring suburbs that had the highest number of low-income families with among the lowest access to food due to the location of grocery stores in 2015. To help support access to grocery stores, a robust public transportation network could be one solution, particularly in Detroit and its surrounding cities. Additionally, it is also important to understand the impact low incomes have on families when it comes to accessing healthy foods. While grocery stores may be within a half-mile or mile from a home, once an individual reaches a grocery store the chances of them purchasing fresh, non-processed foods may not be as high due to cost, and quite possibly access within the store. To support access to fresh foods in urban areas like the City of Detroit the Detroit Food Justice Task Force recommends policies that allow for more support of neighborhood famers markets and small businesses and research that identifies the food needs of neighborhoods throughout the City.