Funding into social service resources are slowly dwindling, and the number of those without permanent shelter may be growing. Throughout Southeastern Michigan, we know that the demand for food at local food pantries/non-profit organizations is increasing (read our recent post about that here), and, so is the need for both temporary and permanent housing, according to area homeless shelters.
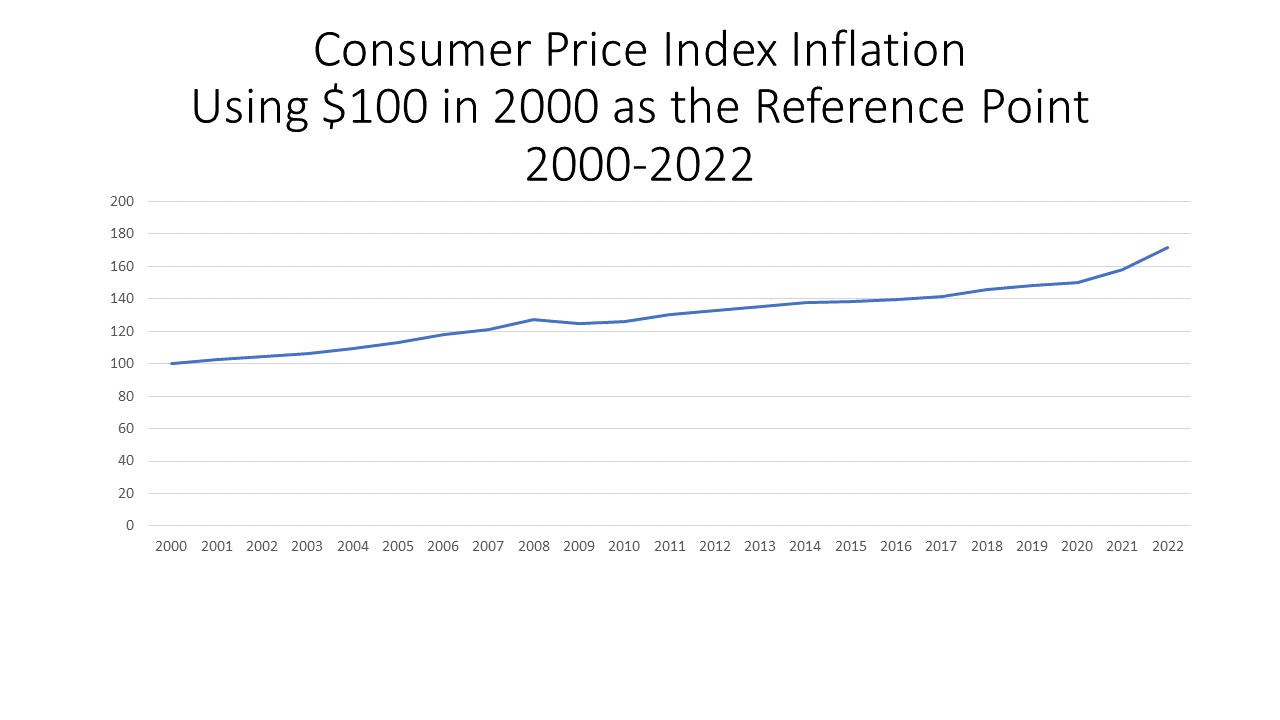
Over the last few years we have experienced a global pandemic, and in reaction the federal government distributed one-time funds and approved moratoriums on policies (evictions, water shut offs and more) to help boost social services and protect some of our most vulnerable populations. As the veil of the pandemic continues to lift so are many of protections put in place to help our vulnerable populations (or funding is declining).
According to the U.S. Department of Housing and Urban Development (HUD), an individual is defined as homeless if they lack a fixed, regular, and adequate nighttime residence and their primary nighttime residence is not meant for human habitation, such as under bridges or in vehicles.
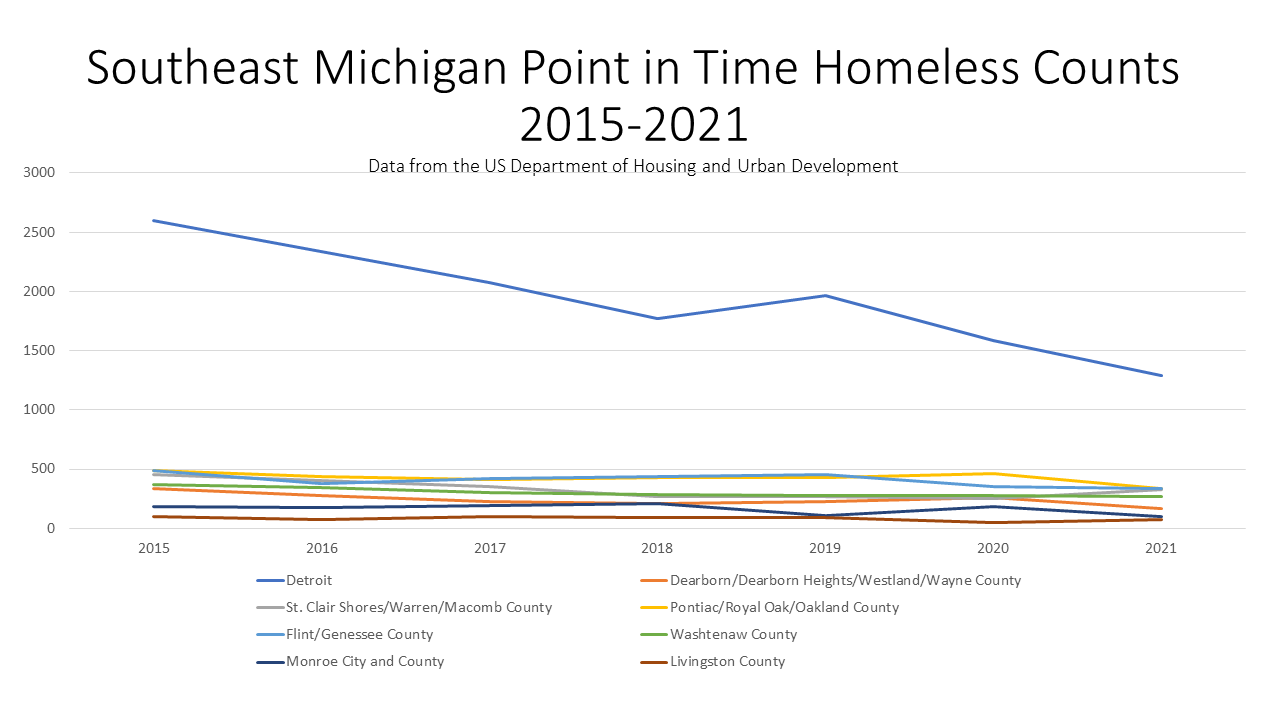
The Point In Time Count is a count of people who are experiencing homelessness on one night in January. It provides a snapshot on the homeless population in an area, but it is by no means all encompassing. While the count is unable to account for every person experiencing homelessness, it also differs on the type of homeless population that is accounted for in each area. For the eight different areas examined in the chart below only three looked at the homeless population that was only sheltered on the night of the count (Detroit, Macomb and Oakland counties); three counted the population that was both sheltered and partially unsheltered (Wayne, Genesee and Washtenaw counties); two counted the homeless population that was both sheltered and fully unsheltered (Monroe and Livingston counties).
The data for the Point In Time Counts is collected by volunteers who collect information from emergency shelters, transitional housing and safe havens. There is also an attempt to collect data on the unsheltered population, but this can be more difficult as it generally involves volunteers traveling to places where people experiencing homelessness are expected to be (under bridges, encampments, etc).
The data below is the Point In Time Counts for the Southeastern Michigan; however data for St. Clair County could not be immediately found but data for Genesee County was included instead.
The City of Detroit has consistently had the highest documented population since at least 2015, according to the Point In Time Count. However, since 2015 the sheltered number of homeless has declined from 2,597 to 1,293 in 2021. None of the other areas in the region had homeless numbers as high as Detroit. In 2021 the area with the second highest documented number was the Pontiac/Royal Oak/Oakland County region with a sheltered only population count of 333. However, in 2021 it is believed the homeless population was closer to at least 1,228, according to data obtained from the Alliance for Housing Oakland County. According to the Point In Time Count data, the Oakland County homeless numbers have also declined.
Overall, according to the Point in Time Count data, each area examined in this blog post has had a decline in its homeless population between 2015 and 2021. Between 2020 and 2021 each area, except Macomb and Livingston counties, experienced a decline. Macomb County had a 79 person increase in its Point In Time County between 2015 and 2021 and Livingston County had a 30 person increase.
The only emergency housing shelter in Livingston County recently shuttered. According to a Michigan Radio news article, the Severe Weather Network Livingston County Homeless Shelter closed due to lack of funds and volunteers and the head of the Michigan Coalition Against Housing fears this won’t be an isolated incident. To alleviate the current homelessness issue, and the larger issue at hand, Eric Hufnagel, head of the Michigan Coalition Against Homelessness suggest public-private partnerships that will create affordable housing, allowing more individuals to permanently get out of the homelessness cycle.
The Michigan Campaign to End Homelessness also sees public-private partnerships and the development of more affordable housing as one means to ends homelessness, according to its Three-Year Action Plan to End Homelessness. The four main strategies of this foundation are to
•Increase access to affordable and attainable housing for all Michiganders experiencing homelessness.
•Use cross-sector collaboration to impact the other Social Determinants of Health that lead to housing insecurity.
•Enhance the homeless service delivery system to better serve those in need.
•Increase prevention and diversion efforts to mitigate the risk of becoming homeless.
As with many solutions, the “fix” to homelessness is multi-faceted.