Recent news that that Roe v. Wade may be overturned in an upcoming US Supreme Court ruling has many examining how such a decision will affect individuals across the country. In Michigan, a 1931 law that defines abortion as a felony could go into affect. This 91-year-old law states that it is illegal to perform abortions in many circumstances, including in cases of rape and incest; it also states that it is illegal to use drugs to induce abortions.
Currently, with Roe v. Wade, still standing, women are legally able to obtain abortions in Michigan with some restrictions, including:
•That a patient must receive state-directed counseling that includes information designed to discourage the patient from having an abortion, and then wait 24 hours before the procedure is provided;
•What coverage, if any, an insurance policy provides (according to the Michigan Department of Community Health 96 percent of reported induced abortions had a self pay source of payment);
•The parent of a minor must consent before an abortion is provided;
•An abortion may be performed at or after viability only if the patient’s life is endangered.
Not only would Michigan be one of at least 26 states where access to safe abortions would be heavily restricted, but thousands of women would be negatively impacted.
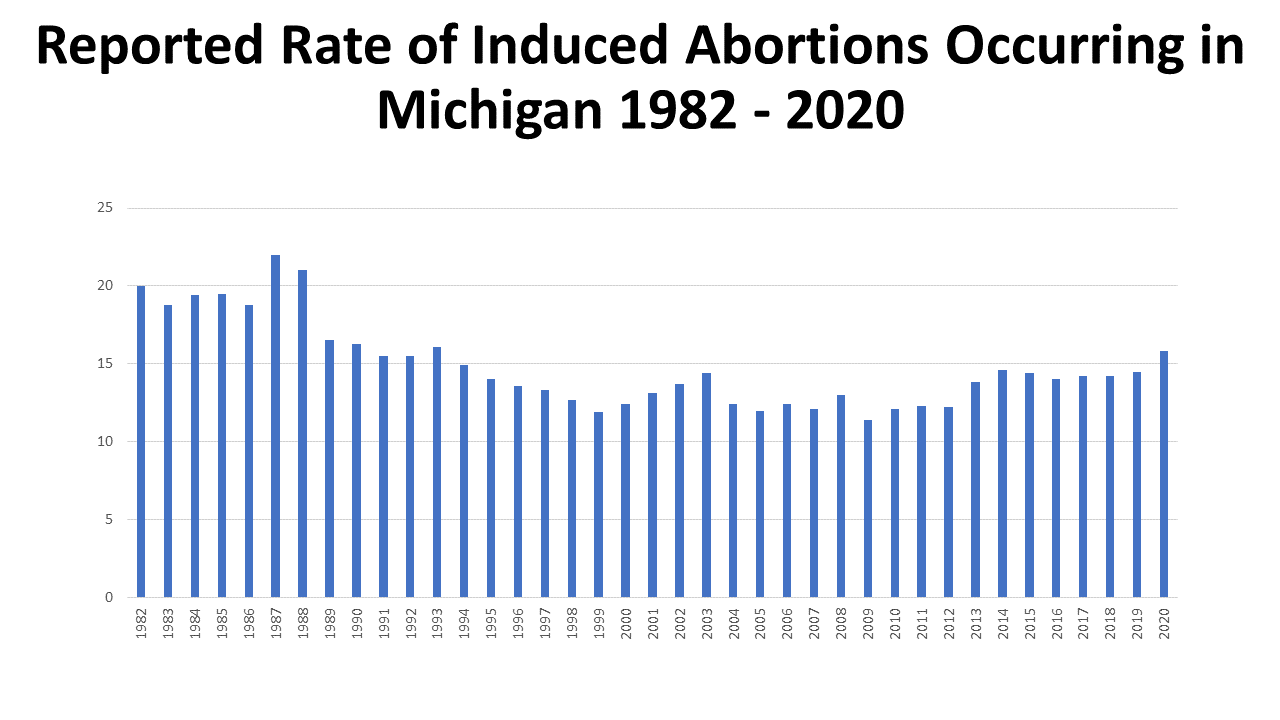
According to the Michigan Department of Community Health, there were 29,669 induced abortions in Michigan in 2020, which was a rate of 15.8 induced abortions per 1,000 Michigan women aged 15-44. This is the highest induced abortion rate in Michigan since 1993, when a rate of 16.1 induced abortions per 1,000 Michigan women aged 15-44 was performed.
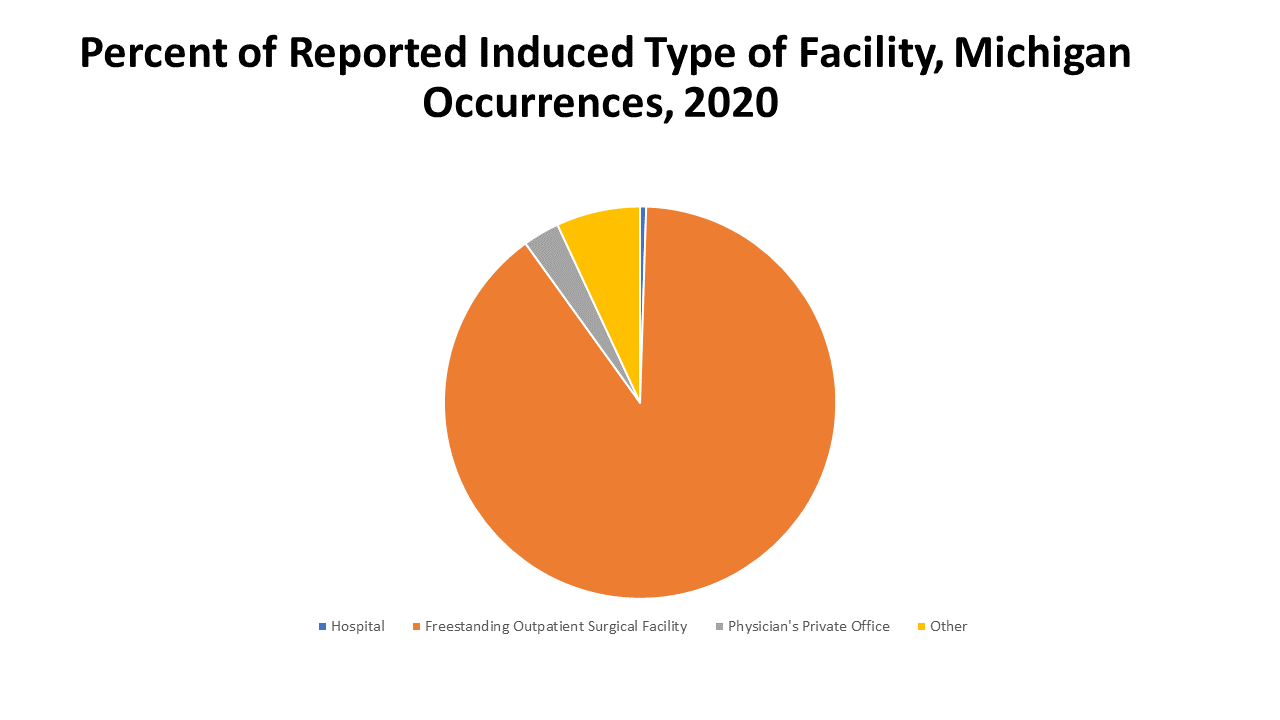
Additionally, of those induced abortions performed in Michigan in 2020 nearly 90 percent were performed in freestanding outpatient surgical facilities. According to the Guttmacher Institute, there were 30 facilities providing abortions in Michigan in 2017, and 21 of those were clinics. Also in 2017, about 87 percent of Michigan counties had no clinics that provided abortions, and 35% of Michigan women lived in those counties.
The data presented in this post shows that many women have abortions for many reasons—including for their health and safety. Every year, the women who chose to have an induced abortion are able to receive one in legal surgical facilities and often pay for the procedure out-of-pocket, as highlighted above. With the possible overruling of Roe v. Wade, thousands of Michigan women, and women across the country, could very well lose the option to have a safe, and legal induced abortion.
In anticipation of the ruling, some options to safeguard legal and safe abortions are occurring: 1)Gov. Gretchen Whitmer filed a lawsuit in April of 2022 calling the Michigan Supreme Court to recognize that the Michigan constitution affords women reproductive rights and agency over their bodies. 2)Planned Parenthood has filed a similar lawsuit, through the Michigan Court of Claims, seeking to declare that the state’s constitution protects reproductive autonomy. 3)A petition drive launched by Reproductive Freedom for All seeks to amend the state constitution to affirm abortion rights. In order to place this on the November ballot 424,000 valid signatures are needed by mid-July. ●
Another means to safeguard abortion access in Michigan would be through approved legislation by the state legislature. Bills to repeal the 1931 ban have been introduced, but not brought forward for a vote.