Michigan’s Right-to-Work Law may very well be a legislative priority come 2023.
The Right-to-Work law was approved in 2012, allowing workers to opt out of paying dues in union represented jobs while still receiving the benefits of being in a union. When Right-to-Work passed Michigan was led by Republicans, but this is about to change in the State.
Following the November General Election there will now be 20 Democrats and 18 Republicans making up the Michigan State Senate and 56 Democrats and 54 Republicans making up the Michigan House of Representatives. Additionally, Democrats continue to hold the top elected seats—Governor, Secretary of State and Attorney General.
With about a month left until the 2023 legislative session kicks off there is speculation that a repeal of this law may be priority for Democrats.
What do we know about unions in Michigan?
First off, organized labor unions were created to advocate for better wages and safer working conditions for employees. In Michigan, some of the largest union organizations include the United Auto Works, the International Brotherhood of Teamsters and the Michigan Education Association.
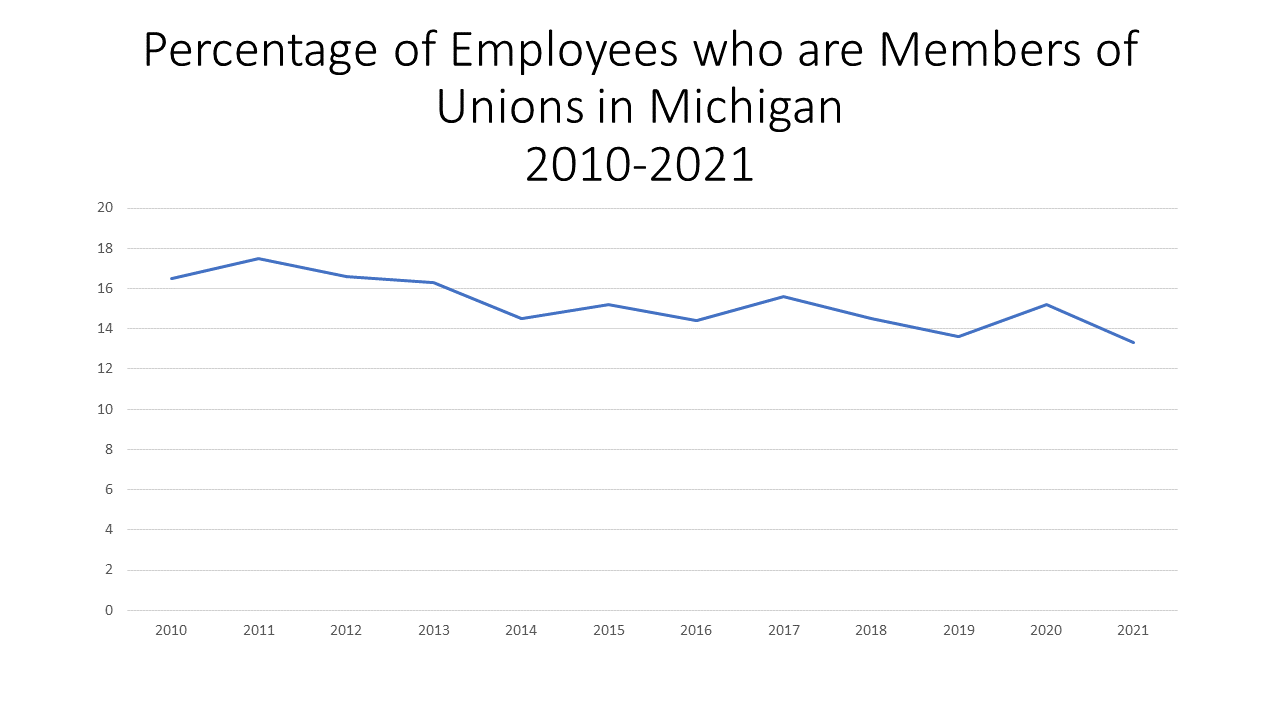
Since 2010 the percentage of employed individuals in Michigan who are members of unions declined from 16.5 percent in 2010 to 13.3 percent in 2021, according to the Bureau of Labor Statistics. In 2021 there were about 540,000 union members in Michigan, with an additional 80,000 wage and salary workers also being represented by a union, according to the BLS. The percentage of employees who are in unions in Michigan reached its peak in 1989 when 26 percent of the workforce was in a union. As noted earlier, Right-to-Work was passed in 2012, and union membership has not exceeded the 2012 percent of employee union representation of 17 since then.
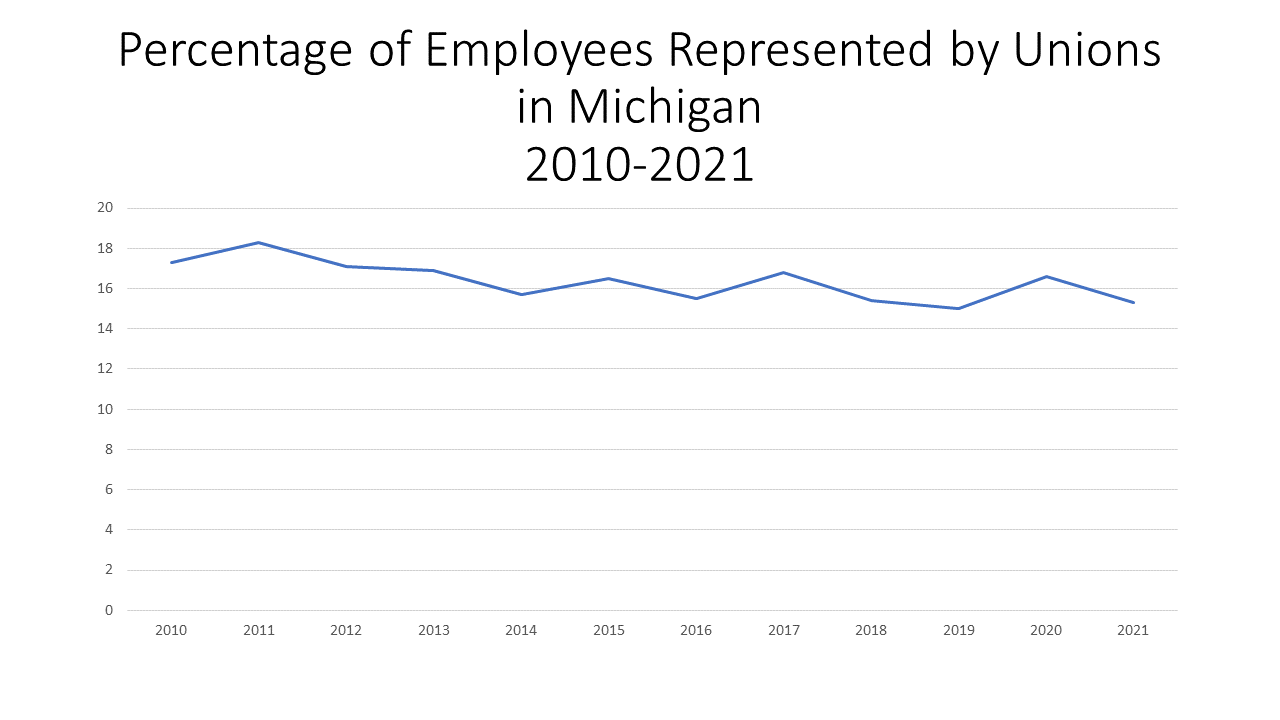
The percentage of employed individuals represented by a union has declined in Michigan, but not as much as membership. According to the BLS, in 2021 15.3 percent of employed individuals in Michigan were represented by a union, a decline from the 17.3 percent representation in 2010 and the 16.6 percent representation in 2020.
While union membership and representation has declined over the last decade, the larger argument at the moment (or so it seems) is what would repealing Right-to-Work in Michigan do for the economy?
One argument is that Right-to-Work states have a higher probability of recruiting manufacturing companies, according to a recent Bridge Michigan article. And, while this may be the case, what will be the wages of those jobs and would they attract employees?
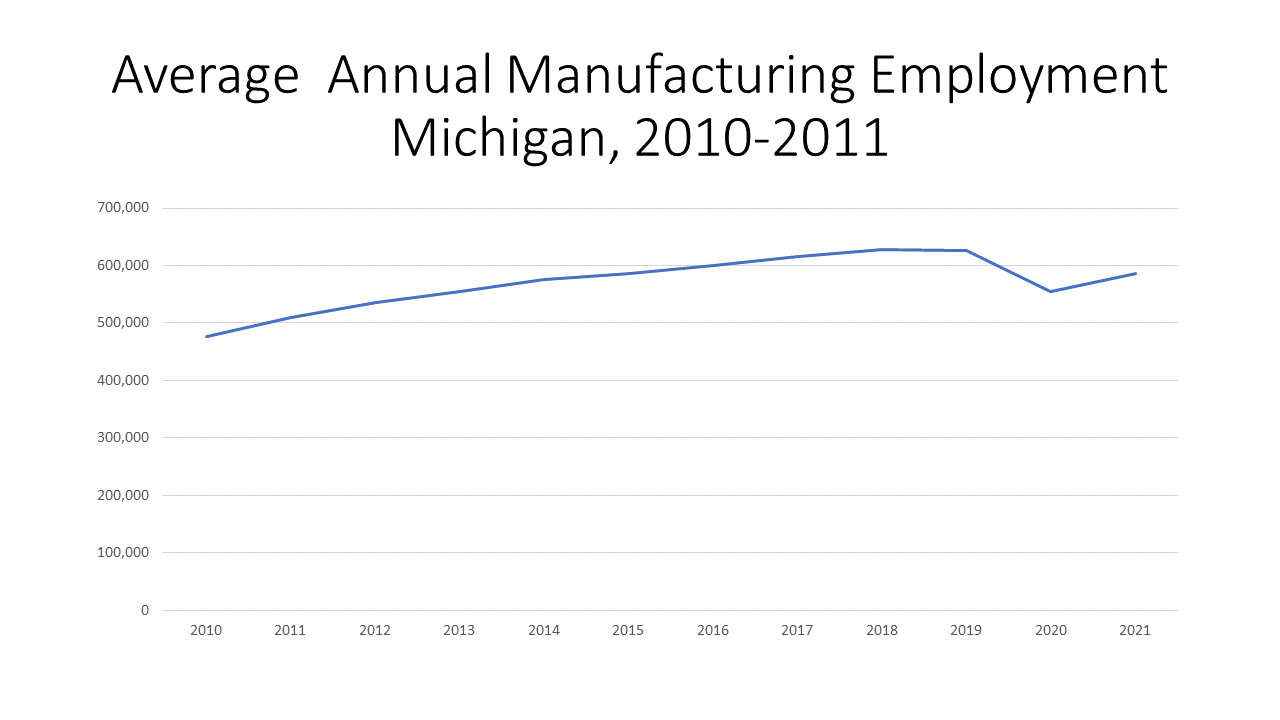
In terms of manufacturing jobs, establishments and wages we know that, overall, those have all increased since 2010, as is shown in the charts below with data from the Michigan Department of Technology, Management and Budget.
In 2010 there were 475,671 manufacturing employees in Michigan and by 2021 that number increased to 585,885. There was a dip in the number of employees in 2020; in 2019 there were 625,766 employees and in 2020 that decreased to 584,818. That number is starting to trend upward again.
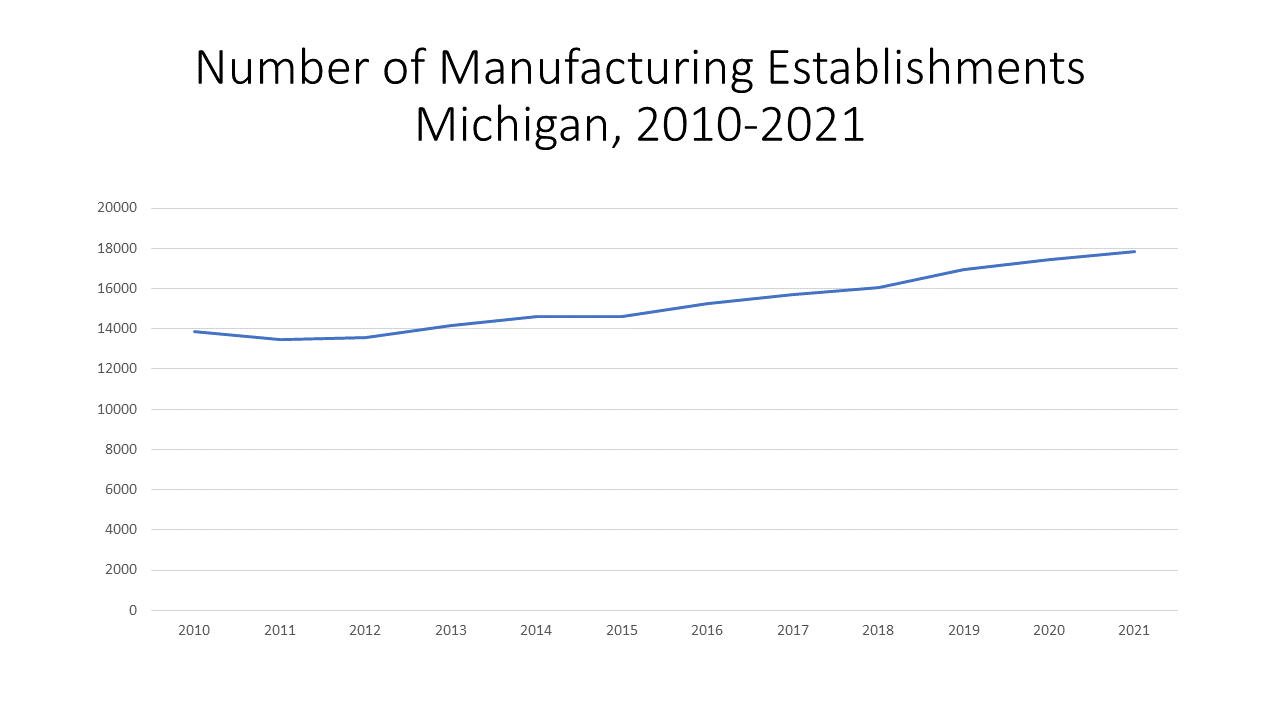
There has been a steady increase in the number of manufacturing establishments since 2010 as well, with there being 13,860 manufacturing establishments in Michigan in 2010 and 17,837 in 2021, according to the Michigan Department of Technology, Management and Budget.
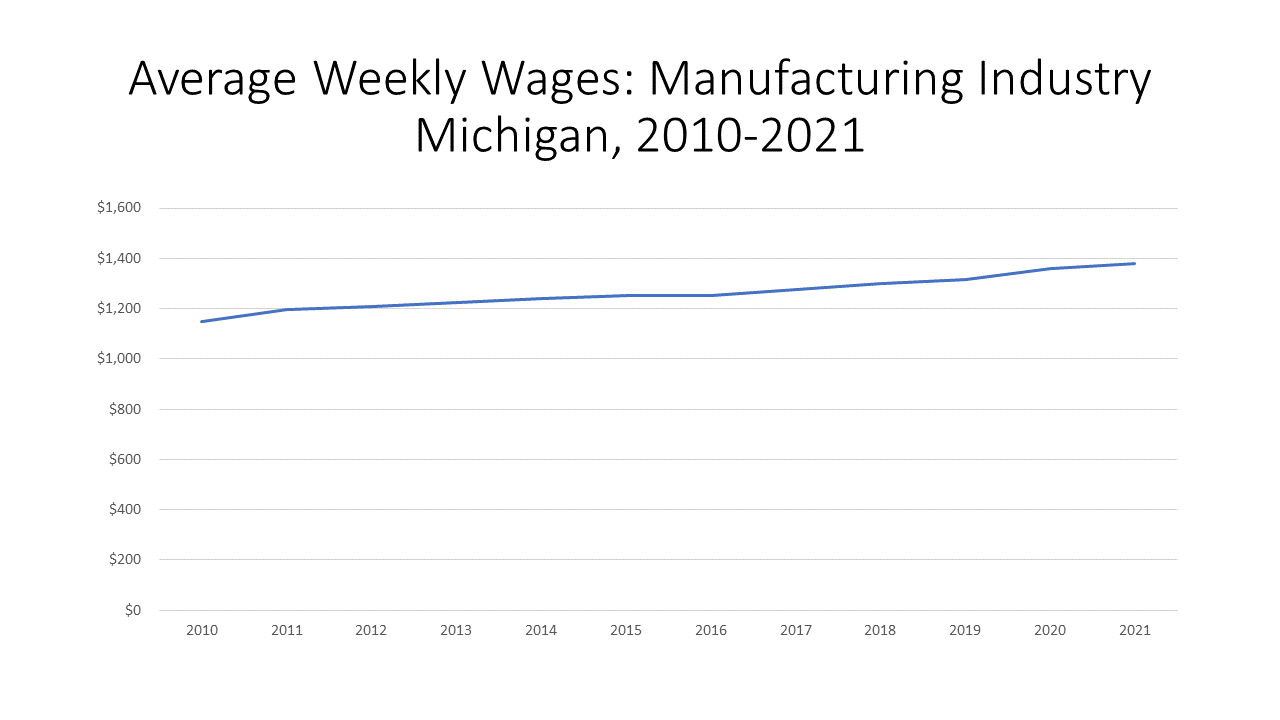
Finally, the average weekly earnings of manufacturing employees have also increased since 2010 but they have not kept up with inflation. As shown in the third chart below, the average weekly earnings of a manufacturing employee in Michigan in 2010 was $1,149, and by 2021 that increased to $1,379. The earnings in that time frame increased by 16 percent but inflation between 2010 and 2021 affected the dollar by 36 percent. In other words, the wage increases did not keep up with inflation.
As political leaders and organizations begin to layout their legislative priorities for the upcoming year it will be interesting to see what tops the list. Area news outlets are reporting that expanding the Earned Income Tax Credit and gun reform are some of the issues that will make its way to the 2023 legislative sessions. At the national level, according to a New York Times article, applications for union elections this year are on pace to approach their highest level in a decade, and according to an August, 2022 Gallup Poll 71 percent of Americans currently approve of labor unions, and 40 percent of union members say their membership is “extremely important.“
Whether or not Right-to-Work will resurface as a top issue in Michigan remains unknown though.