Race Impacts Maternal Mortality, Vulnerability in Michigan and Beyond

Most recently we explored the Maternal Vulnerability Index (MVI), as created and explained by Surgo Ventures, for Michigan and the seven county Southeastern Michigan region. The six sub-indexes that make up the MVI (Reproductive Healthcare, Physical Health, Mental Health and Substance Abuse, General Healthcare, Socioeconomic Detriments and Physical Environment) are based around factors that include access to healthcare, criminal activity in an area and physical and mental health. The direct data around these factors, and more, directly impact a mother’s health. But, another contributing factor to a mother’s health, both directly and indirectly, is her race. According to the MVI by Surgo Ventures, the Midwest has an MVI average score of 37 out of 100, and the highest vulnerability gap between black women and the regional average. Black women are exposed to a 9 point higher vulnerability score than the regional average, driven by higher exposure to vulnerability based on the following sub-indexes: physical health, mental health and substance abuse, socioeconomic determinants and physical environment.

While the MVI does not examine the vulnerability scores at the county and state level through a racial lens we do know the following.

The percentage of the black population in Michigan is 14 percent and the percentage of the black population in Southeastern Michigan is:

  • Livingston County: 0.5%
  • Macomb County: 12%
  • Monroe County: 2%
  • Oakland County: 14%
  • St. Clair County: 3%
  • Washtenaw County: 12%
  • Wayne County: 39%

The percent of black women between the ages 15-50 who gave birth in the past 12 months (2019) was:

  • Livingston County: NA
  • Macomb County: 3%
  • Monroe County: 5
  • Oakland County: 4%
  • St. Clair County: NA
  • Washtenaw County: 5%
  • Wayne County: 6%

Percent of white women between the ages 15-50 who gave birth in the past 12 months (2019)

  • Livingston County: 6%
  • Macomb County: 5%
  • Monroe County: 5%
  • Oakland County: 5%
  • St. Clair County: 6%
  • Washtenaw County: 4%
  • Wayne County: 5%

Percent of black women at or below the poverty level between the ages of 18-64 (2019)

  • Livingston County: NA
  • Macomb County: 5%
  • Monroe County: NA
  • Oakland County: 6%
  • St. Clair County: 13%
  • Washtenaw County: 7%
  • Wayne County: 9%

Percent of white women at or below the poverty level between the ages of 18-64 (2019)

  • Livingston County: 1%
  • Macomb County: 3%
  • Monroe County: 4%
  • Oakland County: 2%
  • St. Clair County: 3%
  • Washtenaw County: 4%
  • Wayne County: 4%


Furthermore, of the black residents in Southeastern Michigan between the ages of 19 to 64 years of age the following percentage had no health insurance in 2019:

  • Livingston County: 4%
  • Macomb County: 5%
  • Monroe County: 5%
  • Oakland County: 4%
  • St. Clair County: 4%
  • Washtenaw County: 5%
  • Wayne County: 6%

Of the white residents in Southeastern Michigan between the ages of 19 to 64 years of age the following percentage had no health insurance in 2019:

  • Livingston County: 3%
  • Macomb County: 5%
  • Monroe County: 3%
  • Oakland County: 4%
  • St. Clair County: 4%
  • Washtenaw County: 3%
  • Wayne County: 5%

While the numbers don’t very greatly, it does show that while there are fewer black women in Southeastern Michigan there is at least an equal, and in some cases a greater, percentage of them who live in poverty, have had children and who do not have health care. Of course, the MVI also looks at factors such as crime where women live (Wayne County has the highest percentage of black residents in the region and the state and Detroit also has one of the highest crime rates), their access to mental health and addiction services, obesity and diabetes rates. All of these are also factors as to why black women in the Midwest are exposed to a 9 point higher vulnerability score than the regional average, which is 37.

Physical Health May Be one of the Biggest Impediments for Maternal Health in Southeastern Michigan

The Michigan maternal mortality rate was 16.4 per 100,000 live births in 2018, according to the National Center for Health Statistics. At the national level in 2017 the maternal mortality rate was 17.4 per 100,000 live births. While Michigan’s numbers were slightly less than the national average, they are still concerning, especially considering the United States has among the highest maternal mortality rates across amongst other nations.

Maternal deaths include deaths of women while pregnant or within 42 days of termination of pregnancy irrespective of the duration and the site of the pregnancy, from any cause related to or aggravated by the pregnancy or its management, but not from accidental or incidental causes.

Understanding, and improving, maternal mortality is important because it helps highlight the effectiveness of the country’s health care system as it relates to general, obstetric and infant care, and is also a human rights issue, as everyone deserves quality and equal care.

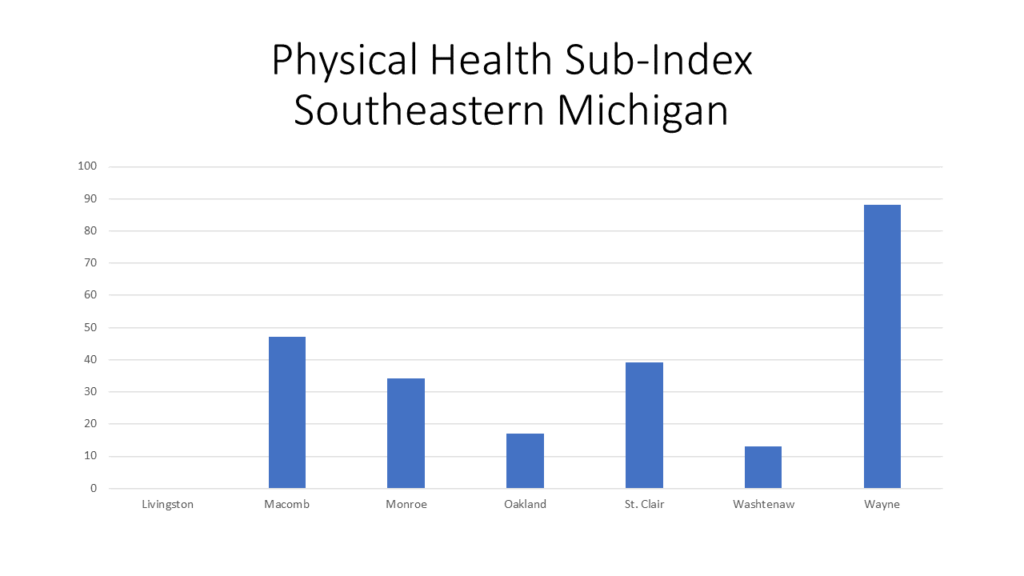
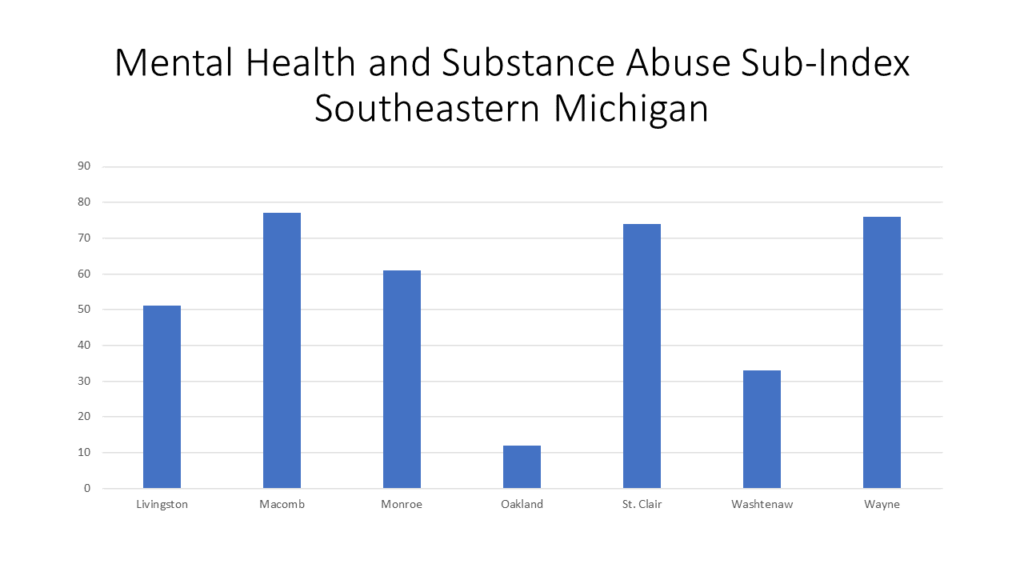
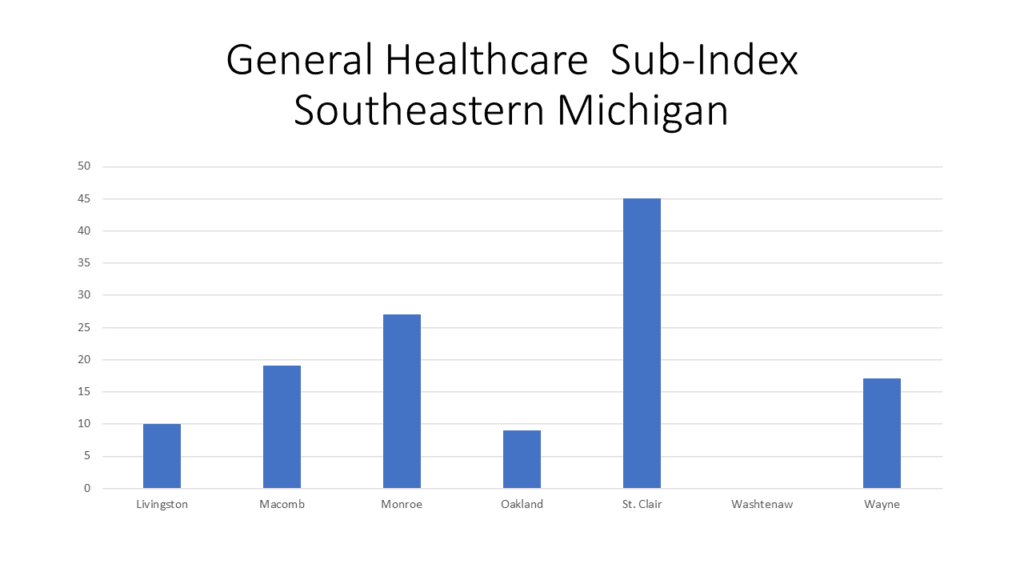
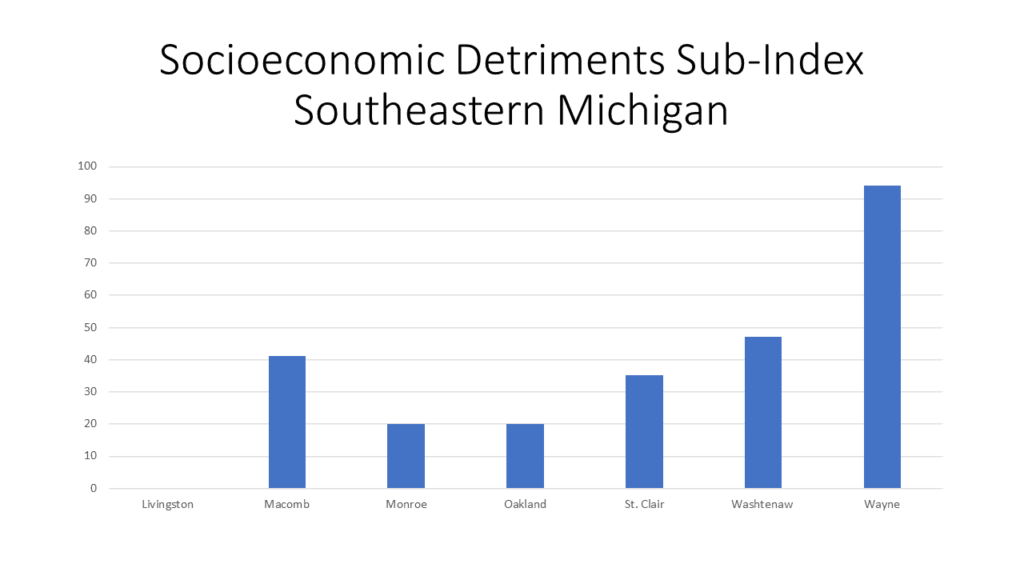
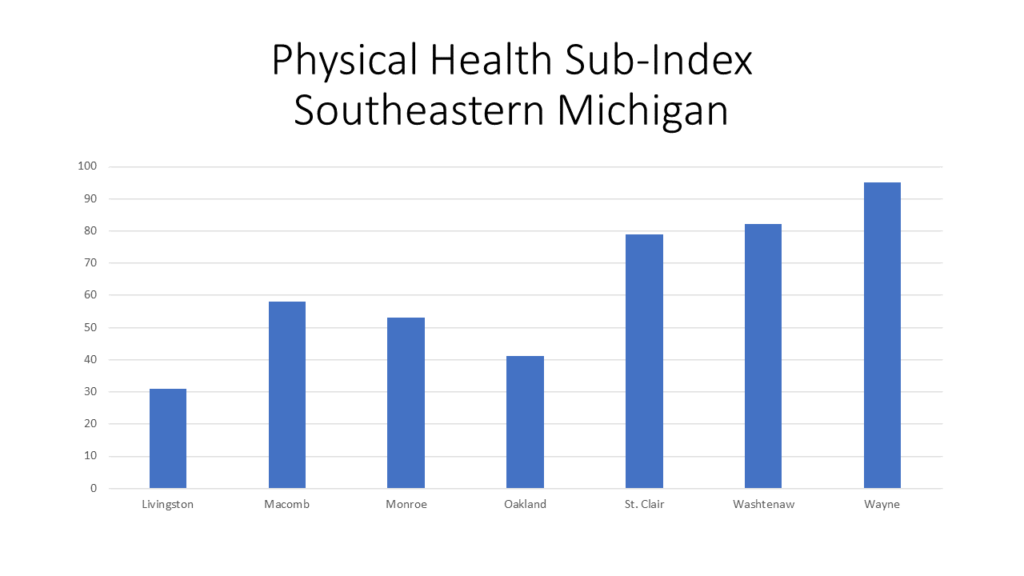
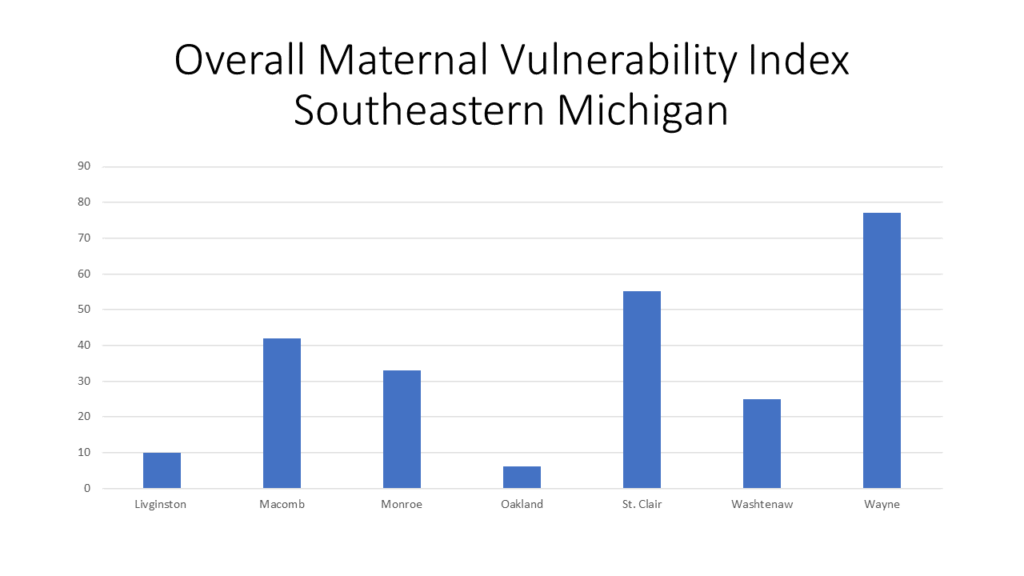
In the graphs below we show what factors impact maternal mortality rates and maternal health in general. Several factors, based off maternal health and community data, were combined by Surgo Ventures, a privately funded action tank, to create the Maternal Vulnerability Index (MVI). This index represents six categories, or sub-indexes, in total: Reproductive Healthcare, Physical Health, Mental Health and Substance Abuse, General Healthcare, Socioeconomic Detriments and Physical Environment. In Southeastern Michigan, and throughout the country, each county and states ranks differently in each category, with the higher number meaning there is an increased vulnerability. This report does not have a national index for the sub-indexes or the MVI as a whole for comparison. The highest level for comparison is at the state level.

The Reproductive Healthcare factor in the MVI is based off a woman’s access to family planning and reproductive services, as well as availability of skilled attendants. As with all the data discussed in this post, the vulnerability level varies greatly by location (again, higher numbers refer to higher vulnerability). In Southeastern Michigan, St. Clair County has the highest Reproductive Healthcare MVI Sub-Index at 50, while nationally there are counties in the Dakotas, Texas, Arkansas, Missouri,  Nebraska and several other states where the Reproductive Healthcare Sub-Index is above 85. The State of Michigan has a Reproductive Healthcare Sub-Index factor of 68. Texas has the highest Reproductive Healthcare Sub-Index of 100 of all 50 states.

For the Physical Health index there is a much wider range of vulnerability in Southeastern Michigan, with Livingston County having a vulnerability level of 0 while Wayne County has a vulnerability level of 88. The State of Michigan has a Physical Health Sub-Index of 66 and comparatively Texas has the highest at 100. The factors that play into the Physical Health vulnerability status include prevalence of noncommunicable diseases and sexually transmitted disease and the percent of females with hypertension, obesity and diabetes. All of these factor can increase the risk of complications and/or death during and after pregnancy.

The Mental Health and Substance Abuse Sub-Index is among one of the higher ones for counties in Michigan, with five of the seven in Southeastern Michigan having a vulnerability index above 50. Macomb County has the highest vulnerability index in the region at 77, followed by Wayne County with an index of 76 and St. Clair County with an index of 74. Michigan has a Mental Health and Substance Abuse Sub-Index of 62 and the State with the highest sub-index is West Virginia at 100. The indicators that play into this index include stress, access to mental health and substance abuse institutions and the overall mental health of mothers in the area.

General Healthcare Sub-Index measures the accessibility, affordability and utilization of healthcare, including insurance coverage and the state’s Medicaid expansion status. Some of the factors of this vulnerability measurement include access to quality medical care, the percent of women of reproductive age who are uninsured, and the postpartum extension status.

St. Clair County has the highest vulnerability index at 45 while Washtenaw County has an index of 0, meaning there is ease in access to and affordability of healthcare for reproductive age women. Michigan has a General Healthcare Sub-Index of 29, and comparatively, the two states with the highest sub-index are Mississippi and Alabama at 100.
General Healthcare Sub-Index measures the accessibility, affordability and utilization of healthcare, including insurance coverage and the state’s Medicaid expansion status. Some of the factors of this vulnerability measurement include access to quality medical care, the percent of women of reproductive age who are uninsured, and the postpartum extension status.
St. Clair County has the highest vulnerability index at 45 while Washtenaw County has an index of 0, meaning there is ease in access to and affordability of healthcare for reproductive age women. Michigan has a General Healthcare Sub-Index of 29, and comparatively, the two states with the highest sub-index are Mississippi and Alabama at 100.
The final sub-index in the overall MVI is Physical Health, of which Wayne County has the highest rate at 95, both in Southeastern Michigan and in the State of Michigan. Michigan has a Physical Health Sub-Index of 82 and of all 50 states Alabama has the highest sub-index at 98. Environmental factors that influence maternal health outcomes include violent crime rates, housing conditions, pollution and access to transportation.

Overall, Wayne County has the highest MVI in Southeastern Michigan, and the State, at 77. Regionally, the county with the second highest MVI is St. Clair County with a rate of 55. At the state level, Michigan’s MVI is 66 and Alabama has the highest MVI of 100. While we know several factors play into the health of a mother and child, this index allows us to examine how all these factors are connected and provide more definitive answers as to why the US’s maternal mortality rate is so poor.

In examining the factors above, it should go without saying that race, socioeconomic status and location are all overarching factors into the MVI. This is examined on a deeper level through the index though and will be further discussed in an upcoming post.

Metro Detroit Small Businesses Recovering, Need Additional Assistance

In 2020, $19.8 billion was spent at small businesses nationwide on Small Business Saturday, a $2 million increase from the $19.6 billion spent the year prior, according to data released by American Express. The hope is that number will be higher in 2021 as many small and local businesses continue to feel economic effects from the COVID-19 pandemic.

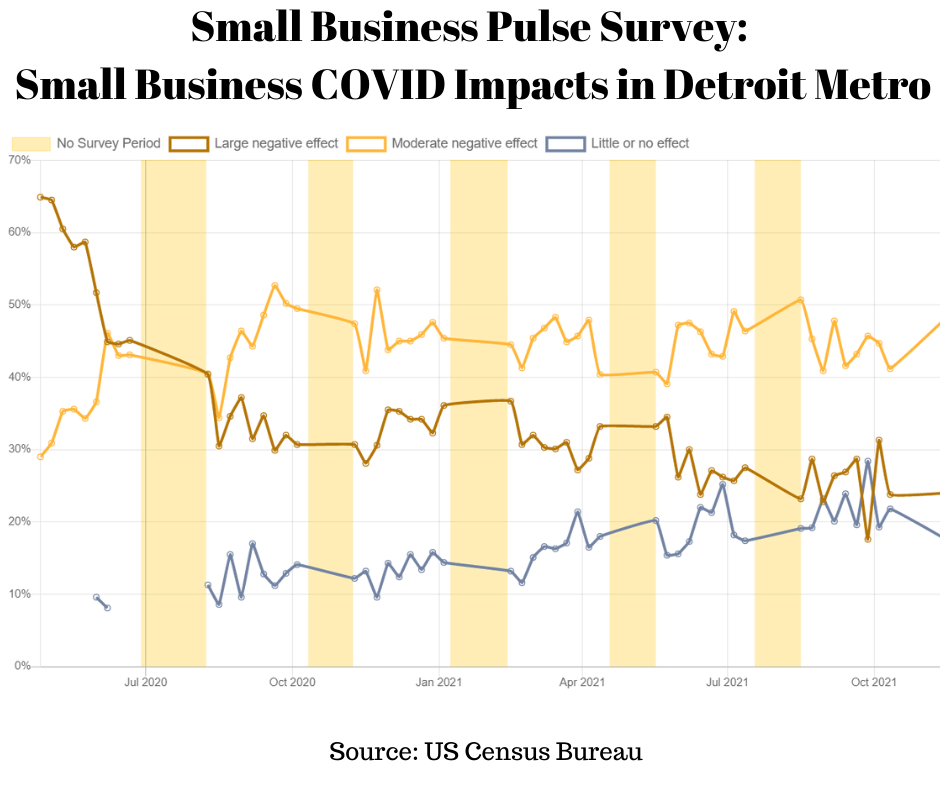
According to the Small Business Administration, $0.68 of every dollar spent at a local business remains in the local economy, or $68 for $100 remains in the local economy. Such investment in a local economy is vital for local success, especially currently as, according to the Nov. 15, 2021 US Census Bureau’s Small Business Pulse Survey, 24 percent of Metro Detroit’s small businesses have experienced a large decline in their business because of COVID; 48 percent have had a moderate negative effect; 18 percent have had little or effect on business because of COVID. As the chart shows, more than 70 percent of small businesses in Metro Detroit experienced a large negative effect from the COVID pandemic when it first began. That number has remained below 31 percent since June of 2021 though while the percentage of small businesses in Metro Detroit experiencing a moderate negative effect due to COVID has remained between 40 and 53 percent since June of 2020. And, while the percentage of small businesses experiencing a moderate negative effect on business has remained fairly consistent for more than a year, it is promising to see the percentage experiencing a large negative effect decreasing while the percentage of those experiencing little to no effect has been increasing.

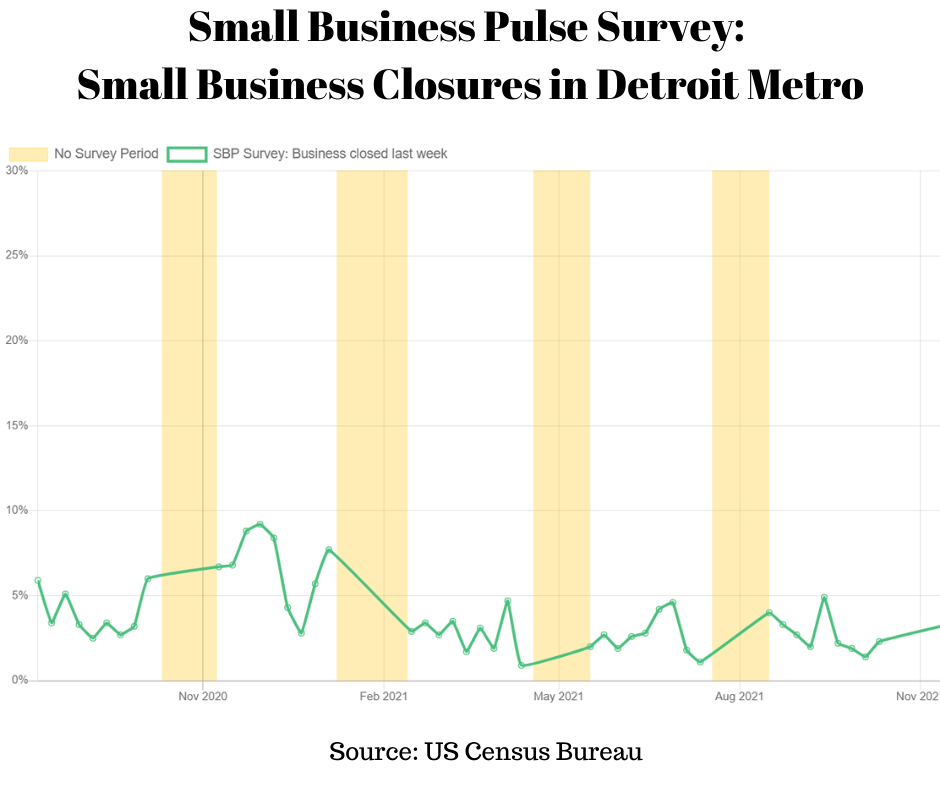
The fact that more small businesses are experiencing little to no negative impact from COVID can also be seen in the percentage of small businesses in Metro Detroit that closed, according to the Nov. 15 2021 Small Business Pulse Survey. The survey asks respondents if their business either temporarily or permanently closed a location in the previous week. The survey covers almost all private-sector industries, including construction, manufacturing, retail, finance, professional and business services, and leisure and hospitality. According to the Nov. 15 survey, 3.3 percent of small businesses surveyed in Metro Detroit had closed. While that is an increase from the 2.3 percent that closed according to the Oct. 11, 2021 survey, it is a decrease from the 9.2 percent that closed about a year ago.

While data does show optimistic signs for a recovering economy, there are still many areas in which small businesses need assistance in to ensure success.

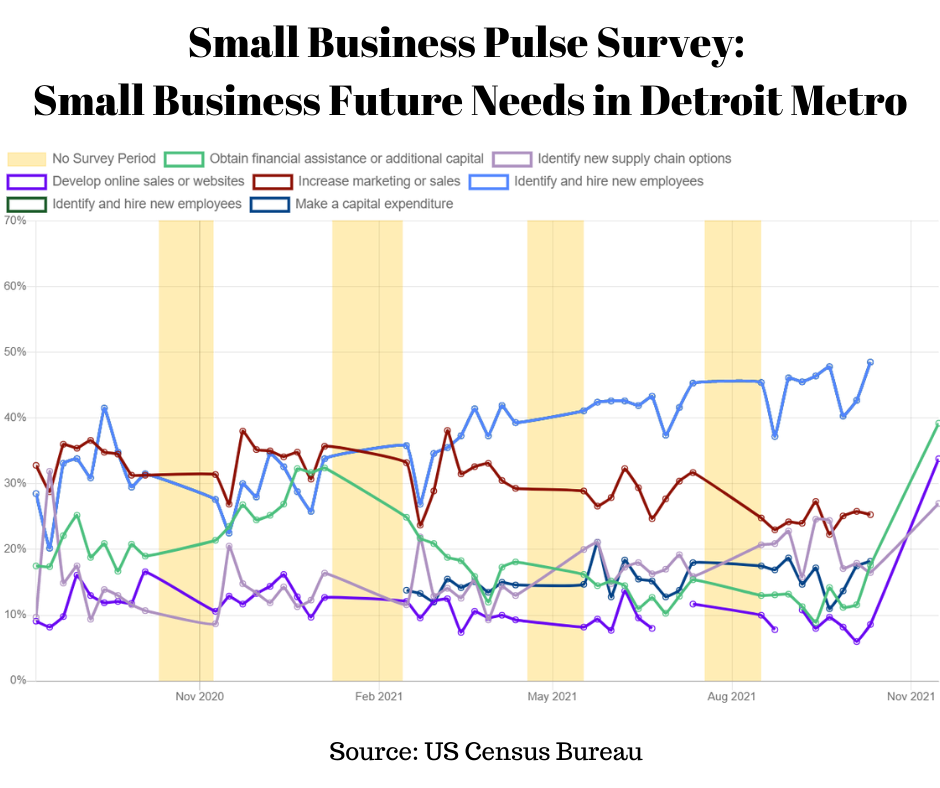
According to the Oct. 11 2021 Small Business Pulse Survey, the largest need for local small businesses in Metro Detroit is to identify and hire new employees. According to the survey, 49 percent of the local small businesses survey said they need to identify and hire new employees for their future success. In the Nov. 15 survey, 39 percent of small business Metro Detroit respondents said they needed to obtain additional financial assistance or capital for future success, 38 percent said they need to develop online sales or web sites and 27 percent needs to develop more supply chain options.

So, while there are signs of economic recovery of for small businesses there are still many needs for their future, and long-term success. Despite an unemployment rate of 6.1 percent in Michigan, there is still a need for employees. As we have discussed prior, living wages are means to attract employees, along with benefits that support employees’ physical and mental health. Navigating the supply chain is a much more difficult concept, as mega-retailers such as Amazon and Walmart continue to be leaders of the pack because of their buying power. However, this could lead to the argument that, given the opportunity, small businesses should fill their inventory with local goods—that is much easier said than done though. Locally made items are much different than items bought from a local store.

The issues surrounding the local economy can be complex, but we can all do our part and invest in small businesses in the holiday season, and year-round. Supporting local not only gives a local business and a local family a chance to survive, but it also strengthens the identity and success of a community.

Hunting Interest Declines in Michigan

Hunting in Michigan isn’t what it once was, at least according to the data. According to the US Fish and Wildlife Service the total number of paid hunting license holders in Michigan has been on the decline for well over 15 years. In 2004 there were 870,432 paid hunting licenses in Michigan and by 2021 that number declined to 642,242 licenses. These numbers are reflective of all the hunting licenses in the State of Michigan, including those purchased by non-residents of the State. In addition to needing a hunting license to hunt in the State of Michigan tags, permits and other regulatory forms are also needed to hunt certain animals in Michigan; those numbers have been declining as well.

According to a recent article by Bridge Magazine, a large reason for the decline of nearly 230,000 hunters in Michigan is because of a shift in interest. The article quotes Dustin Isenhoff, a Michigan Department of Natural Resources research specialist who tracks hunting participation, who says that many of the State’s avid hunters are aging out of the sport, and many of today’s children don’t have the same interest in the sport.

With the decline of participation in hunting also comes the fear of a decline in revenue. Twenty percent of the Michigan Department of Natural Resource’s revenue comes from fees from hunting and fishing licenses. In 2014 then Michigan Gov. Rick Snyder increased the cost of hunting licenses to increase revenue from an already declining sport. In some cases, the cost of a license doubled; a typical deer license once cost a Michigan resident $15, it increased $31. And, while that has brought on increased revenue there is still the fact the number of licenses being sold is dropping significantly.

The map below shows the number of deer harvested in each county in Michigan in 2020; these numbers do not include the 9,557 that were taken with deer management permits though (these are specifically used for population control). One notable area with a high number of harvested deer and several designated hunting areas is Van Buren, Berrien and Cass counties in Southwestern Michigan. However, even with all the number of deer harvested combined in the map below, the total number is less than the number of deer harvested for population management, which is also a controversial topic.

Hunting only does so much to control the deer population as it is seasonal and can only take place on designated lands. There are deer culling programs in places like Grosse Ile and Meridian Township, but, as alluded to earlier, these programs often draw strong opposition. An Ann Arbor program was cancelled after years of opposition from residents.

Some consider deer as a nuisance to gardeners and that they drive out certain species due to their overpopulation and often are a hazard to drivers in certain places. Others note that the natural predators to deer, including coyotes and cougars, were eliminated in most places in Michigan, although the coyote population is now rising.

The issue of deer hunting and population control is one that is complex and requires a delicate balance. Some call to open more public hunting land in Southeastern Michigan to allow for easier access to the sport and to better control the deer population where numbers are growing due to less space for them to live. However, the risks to hikers, cyclists and other users of open space is significant as well.

Between 2010 and 2018, 16 deaths and 86 non-fatal injuries were linked to hunters’ weapons, according to Michigan Department of Natural Resources reports analyzed by Bridge. In 2015 and 2016 there were not any hunter deaths reported; these were the only two years, at least since 1970, when that happened.

The $100K Home May Soon be a Dream of the Past in Southeastern Michigan

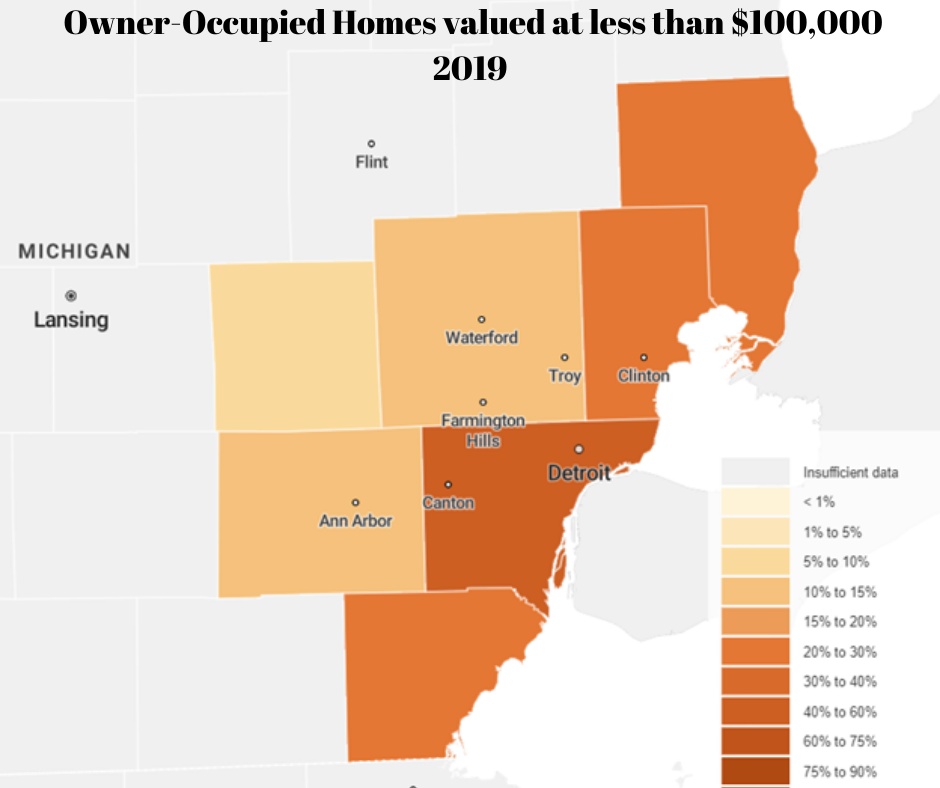
Housing prices continue to soar in the Metro-Detroit region, and beyond.  According to the Case-Shiller Home Price Index, the average price of single-family dwellings sold was $154,160 in July of 2021; this was $1,560 higher than the average family dwelling price in June. Furthermore, the July 2021 price was an increase of $21,700 from July of 2020 and $56,030 from July of 2014. This means, that the average single-family dwelling was being sold for under $100,000 in 2014. The data below shows how pressed a homebuyer would be to find a home for such a price in 2019 (most recent American Community Survey), meaning it is even more difficult today.

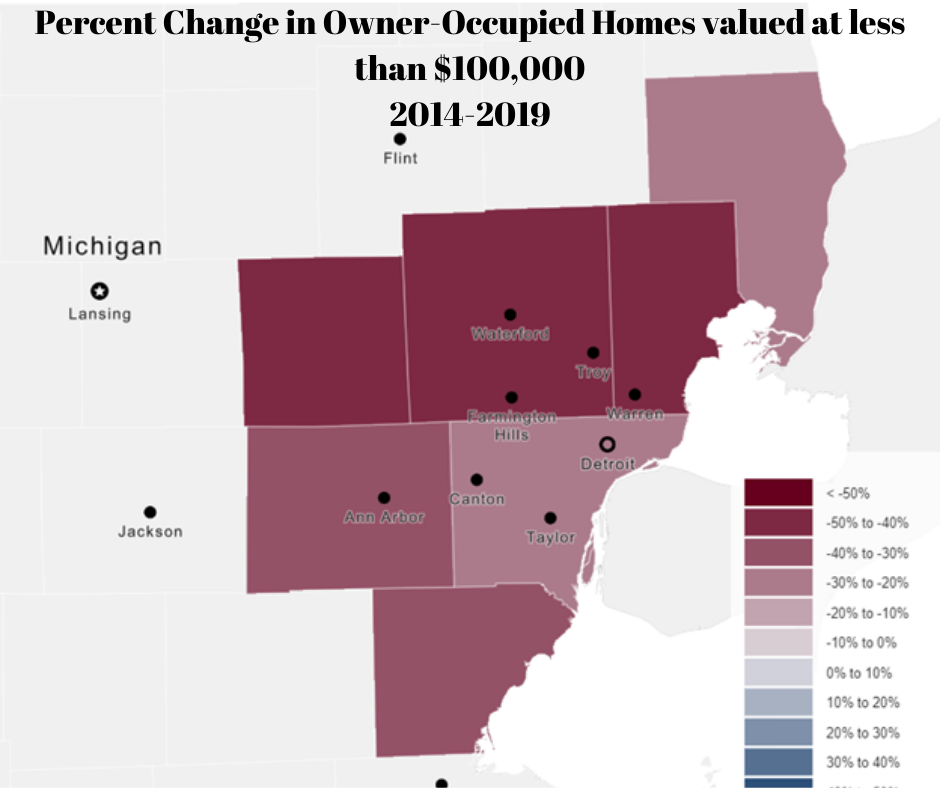
According to the 2019 ACS data, Wayne County had the highest percentage of owner-occupied units that were valued at less than $100,000 at 44.8 percent. The percentage of owner-occupied homes valued at less than $100,000 available in Wayne County in 2019 was 24 percent less than what was available five years prior (2014). Wayne County experienced the smallest decline in owner-occupied units valued at less than $100,000, while Oakland County experienced the largest. In 2019, 12.5 percent of the owner-occupied units in Oakland County were valued at less than $100,000. That number is a 47 percent decrease in the percentage of owner-occupied units valued at less than $100,000 in 2014—five years prior.

While Oakland County had the largest decline in the percentage of owner-occupied units valued at less than $100,000 between 2014 and 2019, it was Livingston County that had the smallest percentage of owner-occupied units valued at less than $100,000 both in 2014 and 2019. In 2019, 8 percent of Livingston County’s owner-occupied housing stock was valued at less than $100,000 and in 2014 it was 14 percent (still the lowest in the region).

Overall, the data shows some of what we already know—particularly that housing prices continue to increase, and at a more rapid rate than in previous years. However, we also know that wages are not increasing with the rate of inflation, and for many, with the rate of increased home prices. As affordable housing continues to remain an issue, it is important to understand where those gaps are also growing at an increased rate. The data shows that, regionally, Wayne County had the largest percentage of homes available for under $100,000, with the number available decreasing at the slowest rate.

Food Prices Increase with Inflation, Food Plans Don’t Add Up

Food prices are one of the many goods and services increasing along with the rate of inflation. These food price increases are being driven up by the increased cost in oil and transportation, worker shortages and weather patterns that have been negatively impacting crops. These factors combined bring a direct impact on the wallets of all of us. Food and beverages are necessities to live, but as prices continue to rise while wages remain stagnant in many industries, access to these necessities may continue to grow more difficult for many families.

According to the U.S. Department of Agriculture (USDA), the average monthly food bill for a family of four on the department’s “thrifty food plan” was $848.40 in September of 2021. In September of 2020, the average monthly bill on the same plan was $676.70. The thrifty food plan is one of four food plans USDA develops that estimate the cost of a healthy diet across various price points – the thrifty, low-cost, moderate-cost and liberal food plans. The thrifty food plan is the lowest cost of the four. It represents the cost of a nutritious, practical, cost-effective diet prepared at home for a family of four, which is defined in law as an adult male and female, ages 20-50, and two children, ages 6-8 and 9-11.

The “liberal food plan” provides broader suggestions for a healthy diet with more leniency in price too. According to the USDA, an average monthly grocery bill for a family of four on the “liberal plan” was $1,339.80 in September of 2020 and was $1,353.90 in September of 2021. Both examples show how food and beverage prices have certainly gone up over the last year, but comparing the thrifty and liberal average grocery bill also shows that there was a greater increase in price for those adhering to a more thrifty plan, as opposed to a liberal plan.

Examples of how grocery money should be spent, according to the USDA, for each child on each food plan are as follows:

Thrifty food plan:

•1.70 lbs of whole grain breads, rice, pasta, or pastries

•0.07 lbs of whole grain cereals

•No popcorn and other grain snacks

•0.76 lbs of non-whole grain breads, rice, pasta, pastries, cereals, or flours

Liberal food plan

•1.37 lbs of whole grain breads, rice, pasta, or pastries

•0.07 lbs of whole grain cereals

•0.46 lbs of popcorn and other grain snacks

•1.46 lbs of non-whole grain breads, rice, pasta, pastries, cereals, or flours

Those on the thrifty food plan are being encouraged to eat more breads, rice and pasta, likely because of their traditionally lower costs for these sometimes nutrient dense food sources.

These difference in cost increases between the two plans and the type of foods families are encourages to eat further highlights how if a certain food group experiences a large increase from one month to the next meal times for families could drastically change.

The thrifty food plan is used to determine Supplemental Nutritional Assistance Program (SNAP) benefit amounts, which vary by household size. By law, the cost of the thrifty food plan in June sets the maximum SNAP benefit amount for a household of four people for the following fiscal year (October 1 through September 30). While the June thrifty food plan suggestions determine the maximum SNAP benefits for a fiscal year, food prices vary on a month-to-month basis, as do the cost of other goods and services.

The Consumer Price Index (CPI) is a measure which helps show how the costs of goods and services change on a month-to-month and a year-to-year basis. The CPI has been increasing nationally and in the Midwest region for the past year, with goods and services such as housing, transportation and fuel all increasing. As already noted, food and beverage prices have also been increasing in recent months, a noticeable change many of us see at the grocery store and in our wallets.

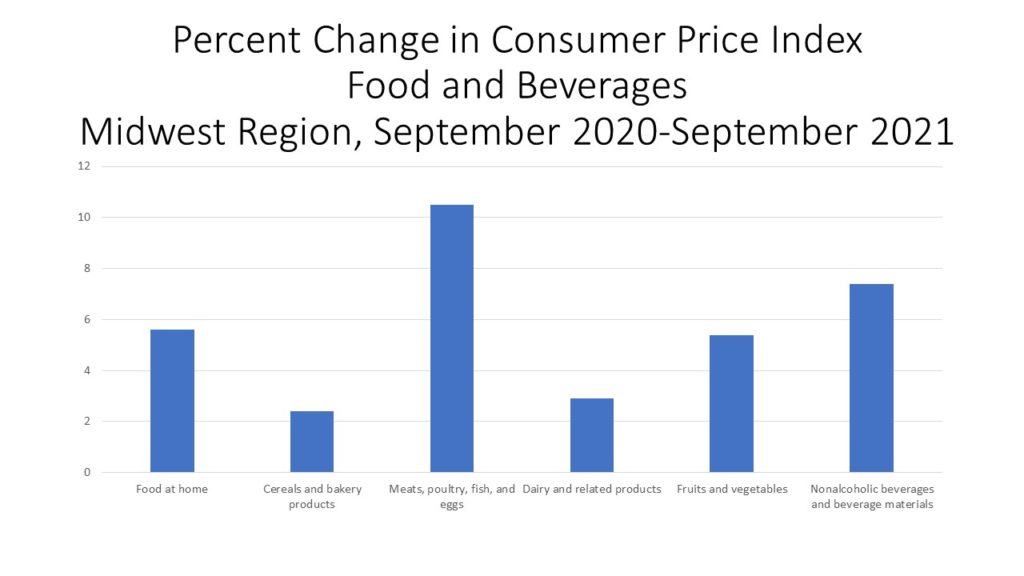
The first chart below shows how food and beverage prices by certain categories changed between September of 2020 and September of 2021, according to the Bureau of Labor Statistics. The highest CPI change in the food and beverage category has been for meat, poultry, fish and eggs. In the last year prices have increased by 10.5 percent. The non-alcoholic beverage category saw the second highest annual increase of the categories shown at 7.4 percent. Cereal and bakery products increased the least at 2.4 percent.

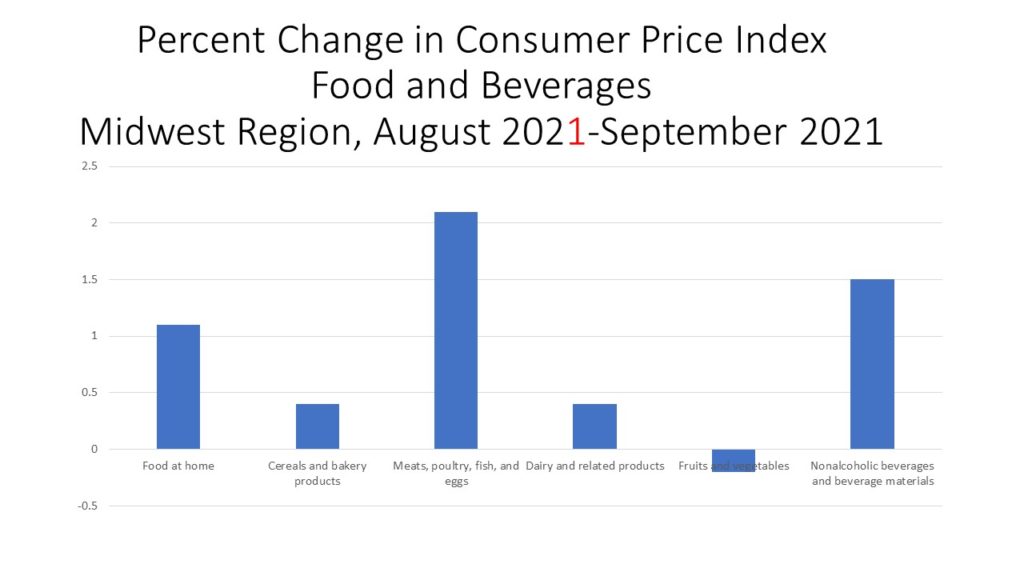
The second chart below shows how food and beverage prices changed between August and September of 2021. Meat, poultry, fish and eggs again had the largest increase at 2.4 percent, followed by non-alcoholic beverages with a 1.4 percent increase. Fruits and vegetable prices, on average, decreased 0.2 percent.

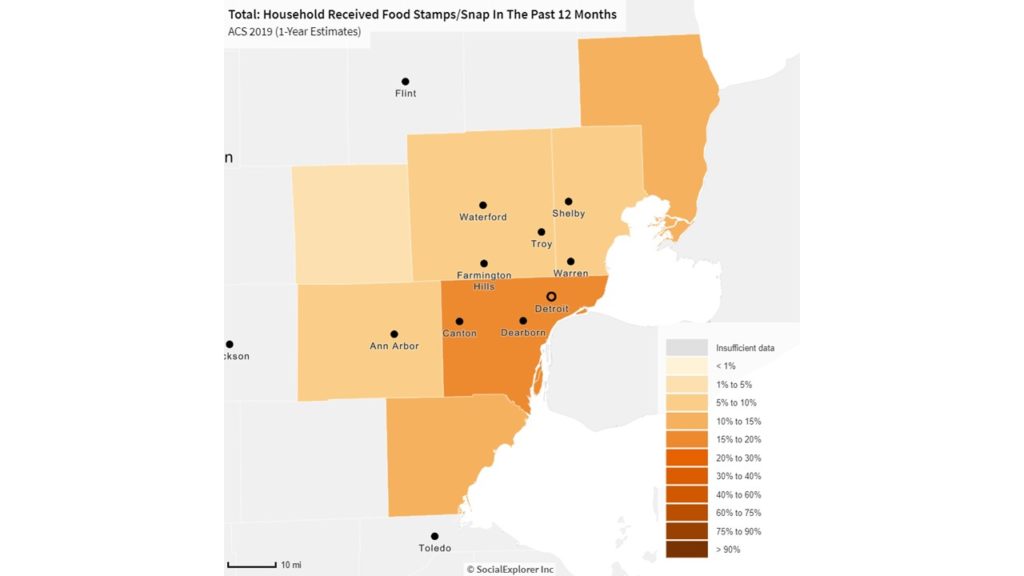
Price increases directly affect families, especially those utilizing assistance programs. For many, a few dollars can mean the difference between some extra groceries, or even a healthier option. In Wayne County alone there were 133,170 households who used SNAP benefits in 2019, and a monthly shift in pricing directly impacts what and how much these families may eat.

According to the US Census Bureau, in Southeastern Michigan, Wayne County had the highest percentage of households utilizing SNAP benefits at about 14 percent, followed by 12 percent of St. Clair County households utilizing the benefits and 11 percent of Monroe County households.

Increasing food and beverage prices is just one of many factors that could drive up the percentage of people in poverty, and drive those in poverty even deeper into it. As noted, increasing food prices are related to increasing costs of transportation (gas), worker shortages and supply and demand. Increasing prices for gas will impact more than just food and beverages too, meaning this is just another area in which the dollar won’t stretch for many Americans. With wages not keeping up with the price of inflation (Michigan’s minimum wage has remained at $9.65 for 2021) or not growing closer to being a “living wage”, many may have to chose between meals, gas and heat and electricity in the coming months.

CPI Soars for Midwest Region

In August of 2021 the unemployment rates for the State of Michigan remained steady from the previous months while the City of Detroit’s unemployment rate took a dip, following a slight increase the month prior. The State of Michigan reported an unemployment rate of 4.4 in August, which was just below the 5 percent unemployment rate reported in July. Since January of 2021 the State’s unemployment rate has not gone above 6.1 percent.

For the City of Detroit, the unemployment rate for August of 2021 was 8.4 percent, which is 1.7 points lower than the July unemployment rate and 10.8 points lower than the August 2020 rate.

Both data sets show that the unemployment rates in Michigan and Detroit are stabilizing to pre-pandemic rates.

The chart above shows unemployment rates beginning to level off and the chart below shows a deeper story—just how drastically unemployment rates have dropped in a year. Each county in Southeastern Michigan experienced an unemployment rate decrease between August of 2020 and August of 2021, with Wayne County experiencing the largest decrease at 8.5 points. In August of 2020 Wayne County had an unemployment rate of 13.3 percent and in August of 2021 it decreased to 4.8 percent. Monroe County had the smallest change in the last year with it recording an unemployment rate of 6.4 percent in August of 2020 and a rate of 5.2 percent in August of 2021. In August of 2021, Monroe County also had the highest unemployment rate regionally. Livingston County reported the lowest unemployment rate in August of 2021 at 2.4 percent while Washtenaw County reported the lowest unemployment rate in August of 2020 at 5.8 percent.

The charts below show the percent changes in the Consumer Price Index (CPI) on a month-to-month basis and a year-to-year basis for each month in years 2019, 2020 and 2021 in the Midwest Region. The CPI is a measure that examines the weighted average of prices of consumer goods and services, such as transportation, food, energy, housing and medical care. It is calculated by taking price changes for each item in the predetermined group of goods and averaging them.

The first  chart below highlights how the CPI changed on a month-to-month basis between 2019 and 2021. Prices in the Midwest region fell to their lowest in April of 2020, a -1.1 percent decline from the month prior; this was just as the pandemic was beginning. Just a month later though they increased by 0.8 percent. Currently in 2021, area prices are up 0.2 percent between August and September. According to the Bureau of Labor Statistics, food prices increased 1 percent between August and September of 2021, and energy prices increased 0.9 percent. Categories that were higher included shelter, apparel, household furnishings and operations.

When examining the second chart, which shows how prices changed on a year-to-year basis,  we see how prices in nearly the entire year of 2020 declined below what they were in 2019 (which was a fairly stable year) and how in 2021 the CPI has been lingering between about 5.5 and 5.9 percent since May. Of course, with the steep decline in 2020 due to the pandemic, we are likely to see a higher CPI in 2021 as everything begins to stabilize. However, some categories are experiencing rather large leaps. For example, in September of 2021 the CPI was up 5.7 percent from a year ago. One of the expenditures that has experienced a large increase in the CPI categories is gas services. Utility services are up 34.2 percent from a year ago and gasoline (motor fuel) is up 45.6 percent from a year ago. Under food and beverages, meats, poultry, fish and eggs experienced the highest increase at a 7.4 percent increase from a year ago, and housing experienced a 5.1 percent increase.
Home prices are being driven up by the demand for housing. In Metro Detroit, according to the Case-Shiller Home Price Index, the average price of single-family dwellings sold was $154,160 in July of 2021; this was $1,560 higher than the average family dwelling price in June. The July  2021 price was an increase of $21,700 from July of 2020 and $56,030 from July of 2014. Home prices have continued to increase year-after-year but the recent average price of single-family dwellings sold in the Metro-Detroit area has increased at a higher rate than in previous years, and it appears it may not be slowing down any time soon.

Pressures to Raise Wages in Michigan Continue

Amidst the COVID pandemic, there are strong pressures to raise wages as government and businesses seek to draw back workers, who have stayed home. We see this in actions on prevailing wages and on minimum wages. Just last week, Gov. Gretchen Whitmer reinstated the prevailing wage for contractors working on State of Michigan projects. The prevailing wage is the average wage rate paid to groups of who do similar jobs/occupations; these wages are typically driven by union contracts. The purpose of a prevailing wage is to ensure companies that bid on government contracts don’t provide a low bid to the detriment of their employees. The new prevailing wage policy, which was originally repealed by the Republican-led Legislature in 2018, will impact only state contracts and projects. Federal projects are already subject to prevailing wage policies and local governments must implement their own policies to ensure fair wages are met.

In Michigan, the prevailing wage policy impacts occupations ranging from asbestos and lead abatement laborers to steel work engineers to roofers, and beyond. A list of occupations and their associated prevailing wages by county in Michigan in 2018 can be found here.

For reference on the difference of a prevailing wage by county, a bricklayer working on a state project in 2018 would have made the below rate, at a minimum:

  • Livingston County: $54.12
  • Macomb County: $52.43
  • Monroe County: $52.43
  • Oakland County: $52.43
  • St. Clair County: $52.34
  • Washtenaw County: $54.12
  • Wayne County: $52.43

According to the US Bureau of Labor Statistics, the mean wage for a brick mason in 2020 was $28.09. Of course, this mean wage accounts for every state in the country, where minimum and living wages vary, along with the cost of living.

In Michigan, the minimum wage is $9.65 an hour and the living wage for one adult with no children is $13.63. And, while Whitmer’s prevailing wage policy will impact state contracts, an increased minimum wage, state or nation-wide, would allow for greater economic stability for a large portion of the population and give way to economic growth.

An increase to the minimum wage requires policy changes, and inherent political tug-of-wars. And, while such actions should still be pursued and hopefully implemented, amidst the political turmoil that will likely occur during these discussions, businesses and local governments can implement their own wage policies. In Michigan, Oakland County and Oak Park both have policies where the minimum wage for their organizations is $15 an hour. Ann Arbor has a living wage policy for its employees and in its contracting ordinance, meaning the City must extend contracts to companies that pay their employees a living wage, at minimum. The Mayor of Jackson also just introduced an ordinance for a $15.68 an hour minimum wage rate for City employees and any contractor, vendor or grantee of City funds. The ordinance also proposes a $13.32 an hour minimum wage rate for employers that provide health care to employees. 

The 2021 living wages for Southeastern Michigan, by county are:

  • Livingston County: $13.91
  • Macomb County: $13.78
  • Monroe County: $13.67
  • Oakland County: $13.78
  • St. Clair County: $13.78
  • Washtenaw County: $15.62
  • Wayne County: $13.78

The above policies show how the State of Michigan and some local municipalities are making progress toward paying employees a true living wage and better aligning wages with salaries. However, the work must continue to ensure that all those employed and seeking employment earn wages that allow them to live a life above the poverty rate, a life in a city, state and country where disparities continue to shrink.

Public Corruption Continues to Grow in Southeastern Michigan

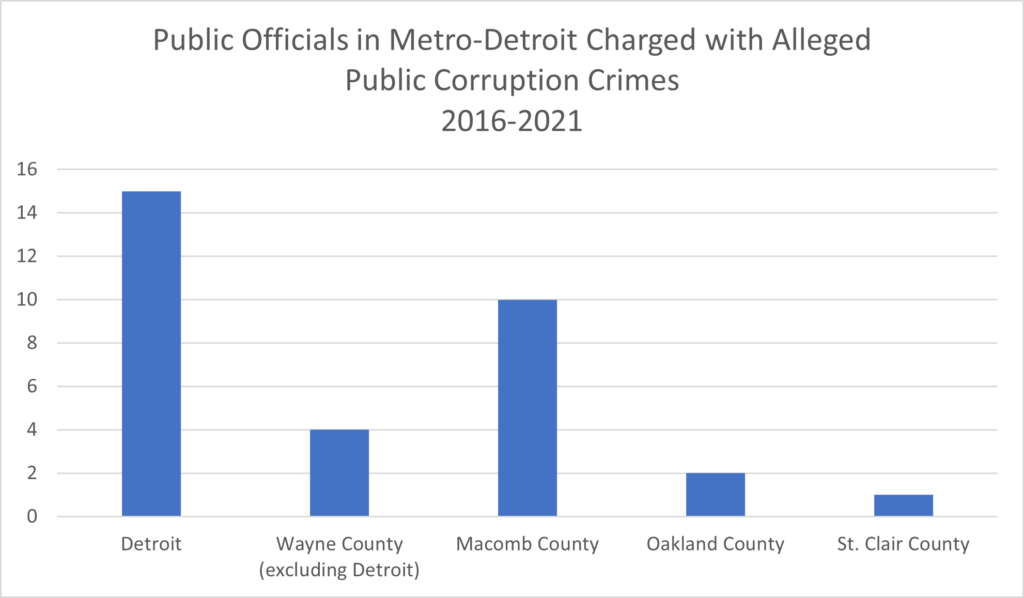
Metro-Detroit is not unfamiliar with public corruption. At least once a year, but usually more often than that, a public corruption cases surfaces in Southeastern Michigan that involves a public official. Recent headlines have been focused on several public officials, including four from the Detroit City Council, three from the Detroit Police Department and three from Macomb County. These charges have surfaced over the last year or so, and have only driven the total number of public corruption cases that can be accounted for in the last four years. In total, there have been at least 32 public corruption charges since 2016 in Southeastern Michigan that involve either an elected official or a public employee. When including public contractors that number rises to about 40.

Most recently, investigations involve Detroit City Councilmembers Andre Spivey, Janee Ayers and Scott Benson. Last week, Andre Spivey pled guilty to federal bribery charges and admitted he and an aide received almost $36,000 in bribes. This case involving Spivey is connected to a larger investigation related to its towing operations. Ayers and Benson have not been charged with any crimes, however their homes have been raided in connection with this broad FBI investigation, according to news reports. The chief of staffs for Ayers and Benson are also included in this investigation but have not been charged. Since Ayers, Benson and their chief of staffs have not been charged with any crimes they were not included in the total number of regional corruption cases since 2016.

In addition to members of the Detroit City Council being investigated for possible crimes related to public corruption tied to City towing policies, so are three members of the Detroit Police Department. According to news reports from the Detroit Free Press and Detroit News, at least three members of the Detroit Police Department are suspected of accepting bribes from towing industry figures; no charges have been filed so these unnamed individuals were also not included in the regional public figure count.

In addition,  former Detroit Councilman Gabe Leland pled guilty to misconduct in office in May of 2021, and he resigned from City Council following the plea. Leland’s guilty plea stemmed from him being indicted on federal bribery charges and a felony misconduct in office charge for accepting $15,000 in cash and free car repairs in exchange for his vote on a land deal, according to the FBI. Leland admitted to accepting the cash when he pled guilty.

As corruption charges continue to surface in Detroit, public information from the FBI, news sources and local court documents shows that there have been at least 15 public corruption cases involving Detroit councilmembers or Detroit staffers; this number does not include contractors or business figures who have been involved in these corruption cases. In Wayne County (excluding Detroit), since 2016, there have been four public corruption charges. Wayne County, including Detroit, has the highest number of public corruption charges in the region, and the state, followed by Macomb County.

In Macomb County, the recent names making headlines for alleged public corruption are former Macomb County Prosecuting Attorney Eric Smith, former Macomb County Chief Assistant Prosecutor Ben Liston and suspended Macomb County Assistant Prosecutor Derek Miller. Miller recently asked for the misconduct in office and conspiracy to commit a legal in an illegal manner charges against him to be dropped. This request came because, according to news reports, Miller’s attorney claims there was no criminal intent with his interaction related to the larger case of alleged misuse of forfeiture funds by Smith. The charges still currently stand against Miller though, and Liston pled guilty to embezzlement charges for improper use of forfeiture funds in September of 2021. With this plea he is required to testify against Smith if requested to do so.

As for Smith, he pled guilty to a federal obstruction of justice charge for covering up theft from his campaign fund. While he pled guilting to this federal corruption charge in January of 2021, he has yet to be sentenced, in part because of his ongoing public corruption case with the State Attorney General’s Office. At the state level, Smith has been charged with five counts of embezzlement by a public official, one count conducting a federal enterprise, official misconduct in office, tampering with evidence in a civil proceeding, accessory after the fact to embezzlement by a public official and one count conspiracy to commit forgery, according to the Michigan Attorney General’s Office. Smith’s felony charges from the Michigan Attorney General’s Office are all in relation to alleged misuse of forfeiture funds. The initial charges against Smith were the state charges and occurred in March of 2020, and the federal charges came in September of 2020.

Since 2016 there have been 10 public officials from Macomb County, either the County organization itself or a municipality within its boundaries, who have been charged with alleged public corruption crimes. There are also cases tied to contractors and overall public corruption cases in Macomb County, that were not included in these counts. Many of the cases are related the Rizzo Environmental Services federal case that entangled elected officials, public employees and business figures who owned the business and worked with it.

No other county in the region or the state has had as many corruption cases the as Wayne and Macomb counties. Since 2016 there has been two public corruption cases in Oakland County and one in St. Clair County; no other county in the region has had any cases come to light.

Corruption cases have long riddled the Metro-Detroit region and in an upcoming post we will detail the ones that have been brought to the public eye since 2016. With more likely in the works, it is important to note that strong local journalism, citizen involvement in local government and an understanding of who is being elected can help reduce corruption cases. Of course, the fix is much more complicated than that, and this too will be explored at a later date.

Michigan’s Congressional Districts to Change Soon

The new Congressional district maps for Michigan have not been finalized, but drafts are in the works, and districts are certain to change.

First off, the process in which Congressional and State House and State Senate districts are drawn has changed. Prior to 2018, the Michigan State Legislature redrew districts using population and demographic data from the US Census Bureau. This process was inherently political and lead to gerrymandered districts, as we highlighted in one of our earliest posts.

Come 2018, a change was mandated when Michigan voters approved the creation of the Michigan Independent Citizens Redistricting Commission. This Commission, which has been regularly meeting and taking public input over the last several months, is led by a bi-partisan citizen group. The MICRC is composed of four Democrats, four Republicans and five independents.

Another change regarding the mapping of Congressional districts was then announced in 2020—Michigan would lose a seat in the US House Representatives-dropping from 14 to 13—due to a shift in population. This is the fifth time in a row Michigan has lost a Congressional seat. This is because that other states have gained substantially more population than Michigan.

 In addition to Michigan losing a Congressional seat so did California, Illinois, Ohio, Pennsylvania, New York and West Virginia. The states that gained a single seat are: Colorado, Oregon, Montana, North Carolina and Florida. Texas gained two Congressional seats.

The map below shows the percent change in population between 2010 and 2020, according to the Census Bureau. And, while the map doesn’t highlight a significant population loss for Michigan it does show how other areas throughout the country are experiencing more rapid population growth while we remain increased only slightly.

Current MICRC proposals that affect Southeastern Michigan include Oakland County being included in five Congressional districts, as opposed to the four it is currently included in, Wayne County in three or four districts, as opposed to the two it is currently located in, and Macomb County being stretched amongst three or four districts, as opposed to the two it is currently in. All of these are still proposed, and non-finalized, maps of course. But this means shakeups for current members of Michigan’s Congressional Delegation. For example, a proposed map shows that current Congressman Andy Levin and current Congresswoman Brenda Lawrence could be living in the same district. Another proposed shift is for the 10th District, which could include parts of Oakland, Macomb and Genesee counties. The current Congress members who represent parts of that new proposed district are Elissa Slotkin (D-Holly), Dan Kildee (D-Flint) and Lisa McClain (R-Bruce Township). If that proposal were to move forward those current members of Congress could all be vying against each other in the election process.


According to the criteria approved by voters when they approved the MICRC, new district maps must:
·        Comply with the U.S. Voting Rights Act and be of equal population;
·        Be geographically contiguous;
·        Reflect the state’s diverse population and communities of interest;
·        Not provide a disproportionate advantage to any political party;
·        Not favor or disfavor an incumbent;
·        Respect county/municipal borders;
·        Be reasonably compact.
 
While Michigan’s population has changed minimally, there still have been population shifts internally, which will also impact the new Congressional districts.
For example, St. Clair County lost 1.6 percent of its population and Wayne County lost 1.5 percent of its population between 2010 and 2020, while Washtenaw County experienced about an 8 percent population increase, and Livingston County experienced about a 7.5 percent population increase. While Congressional seats don’t include just one county, understanding where the State’s population has shifted does help shed light on how the districts may shift.

The final Congressional District maps will go into play for the 2022 election. Three maps for final consideration must be chosen by the MICRC on Oct. 1, 2021. To leave a comment on the proposed maps or the process visit here.