It’s no secret that over the last year-and-a-half the housing market has experienced an increase in the number of sales and prices and a decrease in stock. At a time when economic stability has been uncertain for hundreds of thousands, an obvious question is—what is driving the housing market up? As the data sets below show there are several factors behind rising sales and decreasing housing stock.
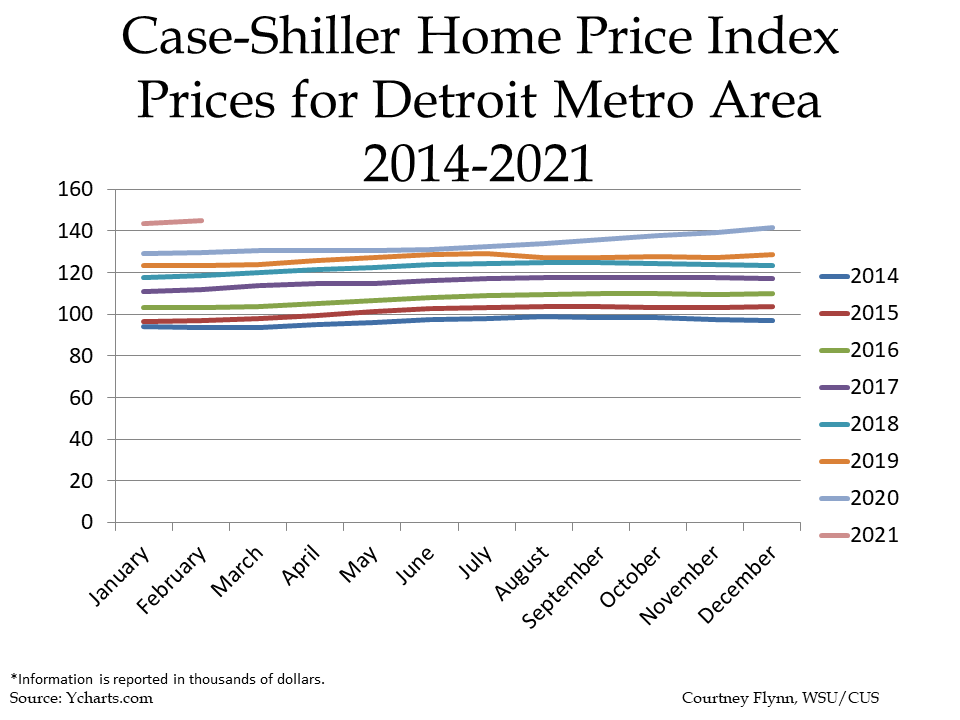
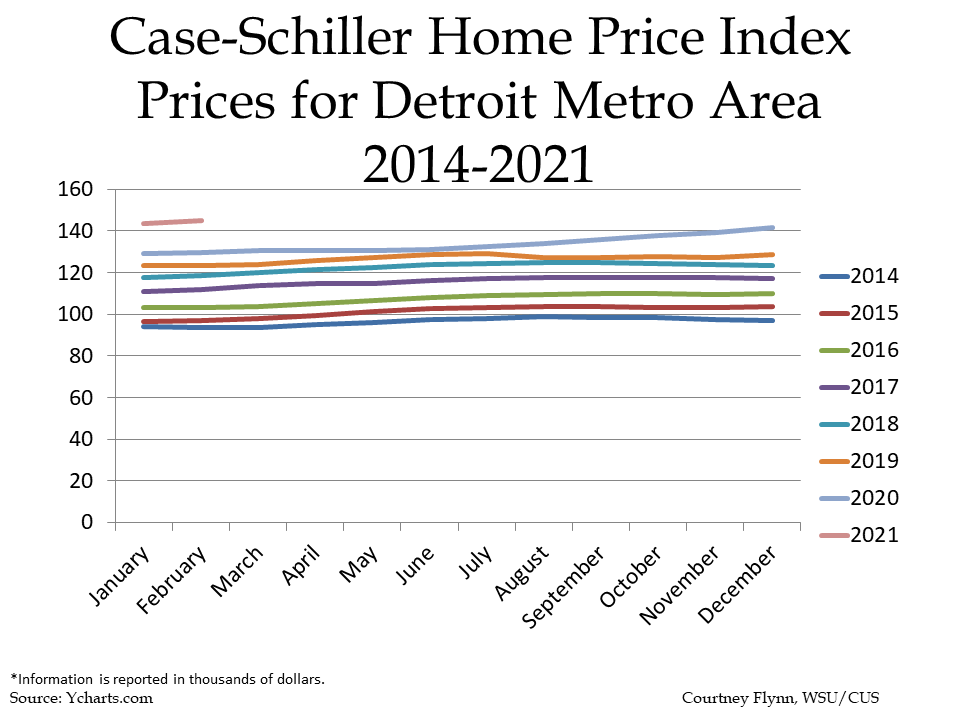
First, understanding how the average price of a single-dwelling unit has changed over the last several years is important in understanding how housing prices got to where they are today. According to the Case-Shiller Home Price Index, the average price of single-family dwellings sold in Metro Detroit was $148,500 in February of 2021; this was $1,500 higher than the average family dwelling price in January. The February 2021 price was an increase of $14,070 from February of 2020 (over a 10 percent increase) and $49,430 from February of 2014. Home prices have continued to increase year-after-year but the recent average price of single-family dwellings sold in the Metro-Detroit area has increased at a higher rate than in previous years.
One reason behind the increased cost of a single family dwelling unit is the supply. Simply put, the availability is not meeting the demand. According to a RE/MAX of Southeastern Michigan housing report from March, the supply of inventory for available homes is at less than a month. A balanced housing market has six months supply of inventory, according to RE/MAX. According to the National Association of Realtors a months supply of inventory means the number of months it would take for the current inventory of homes to sell if no other homes were to hit the market.
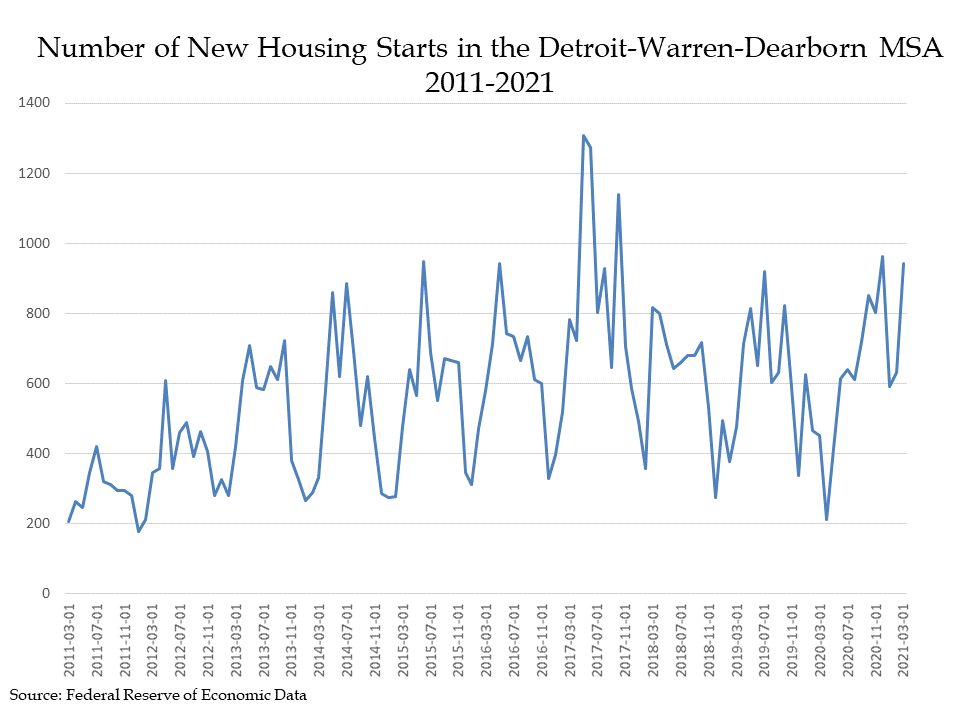
One way to increase inventory is to build more homes. However, this takes time and also costs money. According to the Federal Reserve of Economic Data there were 942 housing starts in the Detroit-Warren-Dearborn Metropolitan Statistical Area as of March 1, 2021; on March 1, 2020 there were 452 housing starts. While the data shows an increase in housing starts since 2020, housing starts have not reached the peak levels of 2017 (1,308 on May 1, 2017). In order to move housing starts along there needs to several things, including demand, enough workers to meet demand, and supplies.
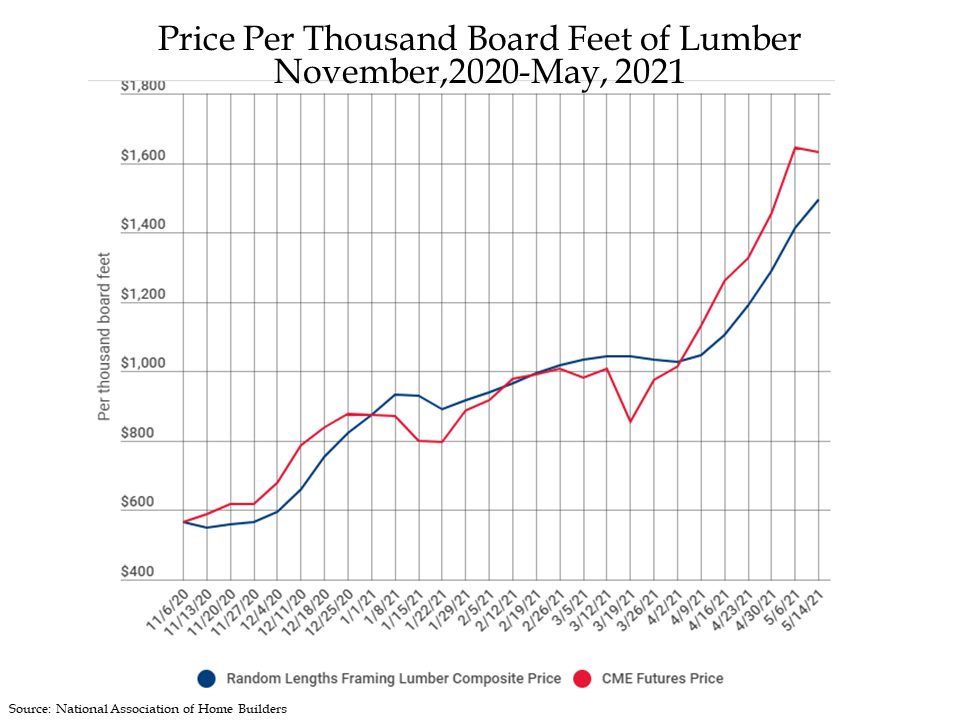
Lumber is a large component in building homes, and completing remodels. With a higher demand for new housing starts and remodels, the price of lumber has increased nationally. According to the National Association of Home Building, lumber prices have increased by more than 300 percent since April 2020; this has caused the average price of a new single-family home to increase by nearly $36,000.
The chart below shows an overview of how framing lumber prices have fluctuated, and grown, in recent months. As of May 14, 2021 the average price of lumber per thousand board feet was about $1,500; in early November of 2020 the price was recorded at just under $600. The information is sourced each week using the Random Lengths Framing Lumber Composite which is comprised using prices from the highest volume-producing regions of the U.S. and Canada.
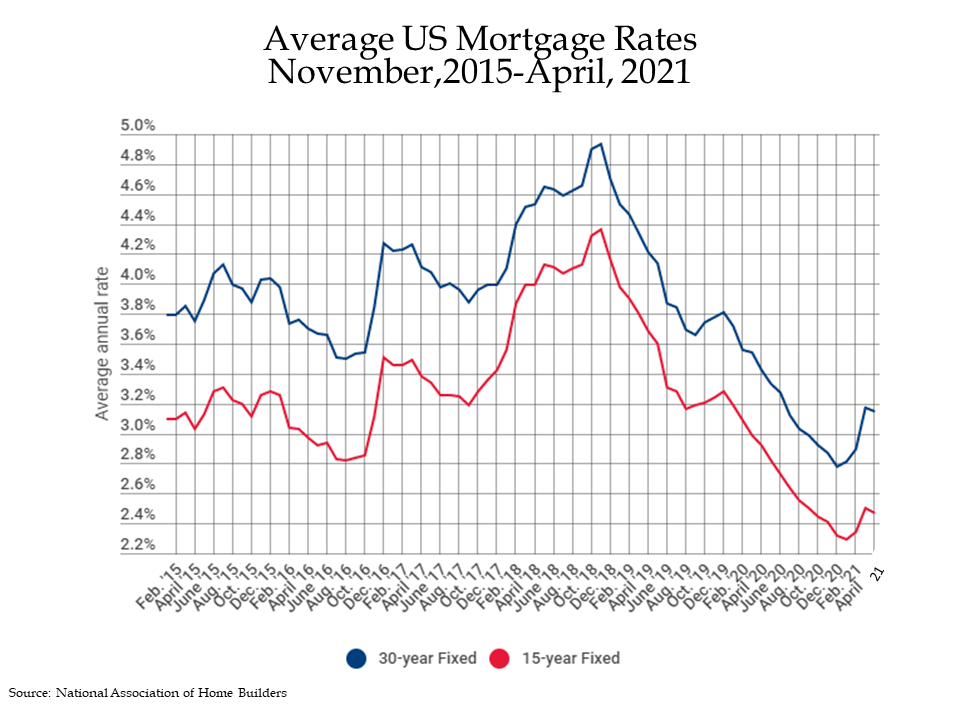
In addition to supply and demand of housing stock and materials, low mortgage rates are also behind an increase in home sales. According to the National Association of Home Builders the average annual rate of a 30-year fixed mortgage in April 2021 was 3.15 percent; the average annual rate for a 15-year fixed mortgage in April 2021 was 2.47 percent. The data shown below goes back to February of 2015 and in that time frame rates have never been as low as they have been within the last year. While the April rates are slightly up from the December 2020 rates, overall mortgage rates have been decreasing since December of 2018.