In 2020, $19.8 billion was spent at small businesses nationwide on Small Business Saturday, a $2 million increase from the $19.6 billion spent the year prior, according to data released by American Express. The hope is that number will be higher in 2021 as many small and local businesses continue to feel economic effects from the COVID-19 pandemic.
According to the Small Business Administration, $0.68 of every dollar spent at a local business remains in the local economy, or $68 for $100 remains in the local economy. Such investment in a local economy is vital for local success, especially currently as, according to the Nov. 15, 2021 US Census Bureau’s Small Business Pulse Survey, 24 percent of Metro Detroit’s small businesses have experienced a large decline in their business because of COVID; 48 percent have had a moderate negative effect; 18 percent have had little or effect on business because of COVID. As the chart shows, more than 70 percent of small businesses in Metro Detroit experienced a large negative effect from the COVID pandemic when it first began. That number has remained below 31 percent since June of 2021 though while the percentage of small businesses in Metro Detroit experiencing a moderate negative effect due to COVID has remained between 40 and 53 percent since June of 2020. And, while the percentage of small businesses experiencing a moderate negative effect on business has remained fairly consistent for more than a year, it is promising to see the percentage experiencing a large negative effect decreasing while the percentage of those experiencing little to no effect has been increasing.
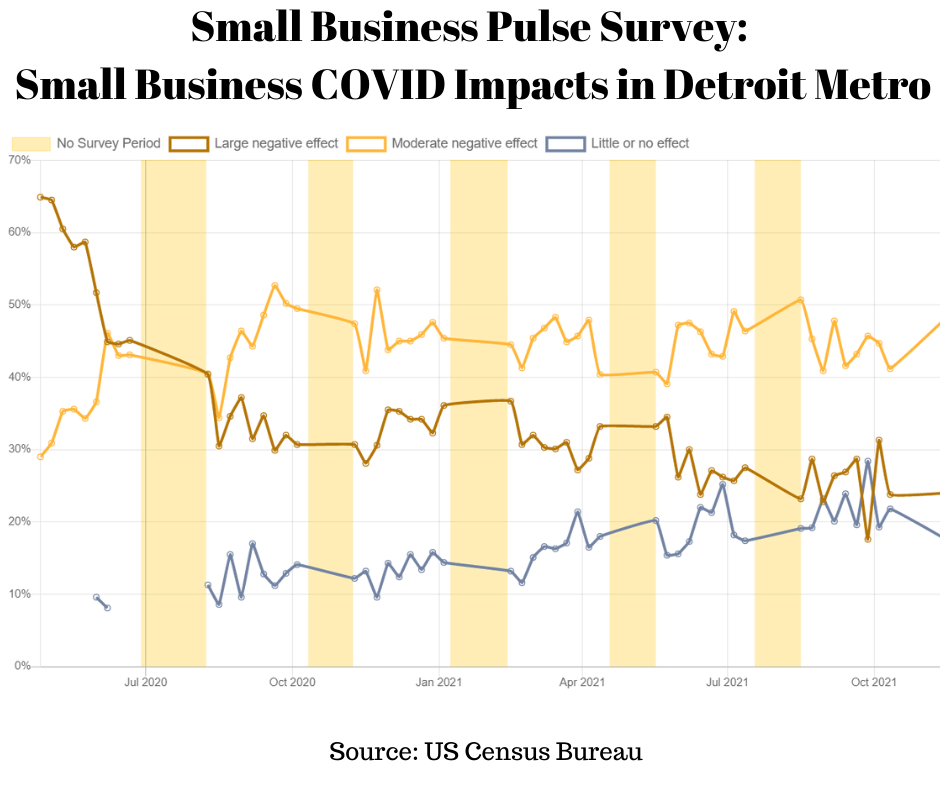
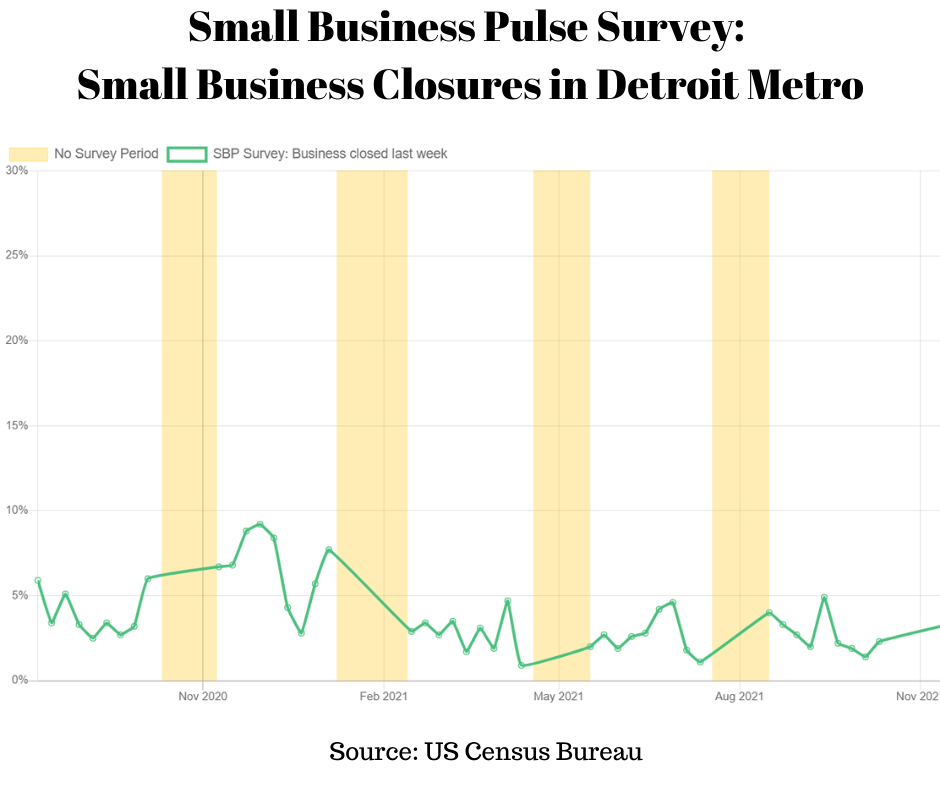
The fact that more small businesses are experiencing little to no negative impact from COVID can also be seen in the percentage of small businesses in Metro Detroit that closed, according to the Nov. 15 2021 Small Business Pulse Survey. The survey asks respondents if their business either temporarily or permanently closed a location in the previous week. The survey covers almost all private-sector industries, including construction, manufacturing, retail, finance, professional and business services, and leisure and hospitality. According to the Nov. 15 survey, 3.3 percent of small businesses surveyed in Metro Detroit had closed. While that is an increase from the 2.3 percent that closed according to the Oct. 11, 2021 survey, it is a decrease from the 9.2 percent that closed about a year ago.
While data does show optimistic signs for a recovering economy, there are still many areas in which small businesses need assistance in to ensure success.
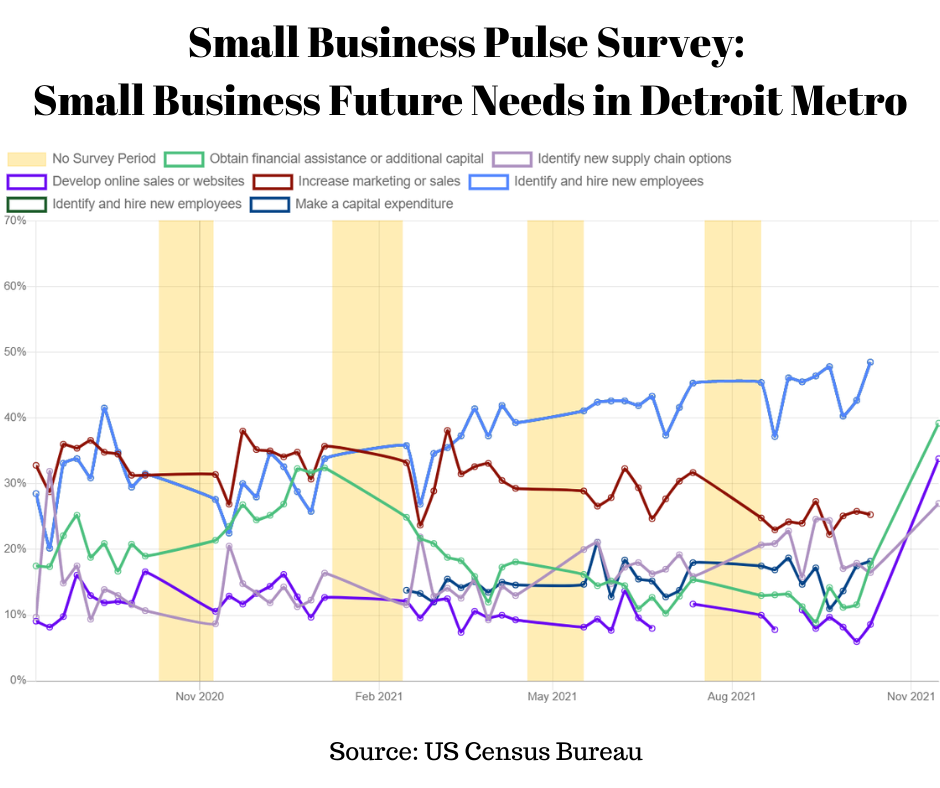
According to the Oct. 11 2021 Small Business Pulse Survey, the largest need for local small businesses in Metro Detroit is to identify and hire new employees. According to the survey, 49 percent of the local small businesses survey said they need to identify and hire new employees for their future success. In the Nov. 15 survey, 39 percent of small business Metro Detroit respondents said they needed to obtain additional financial assistance or capital for future success, 38 percent said they need to develop online sales or web sites and 27 percent needs to develop more supply chain options.
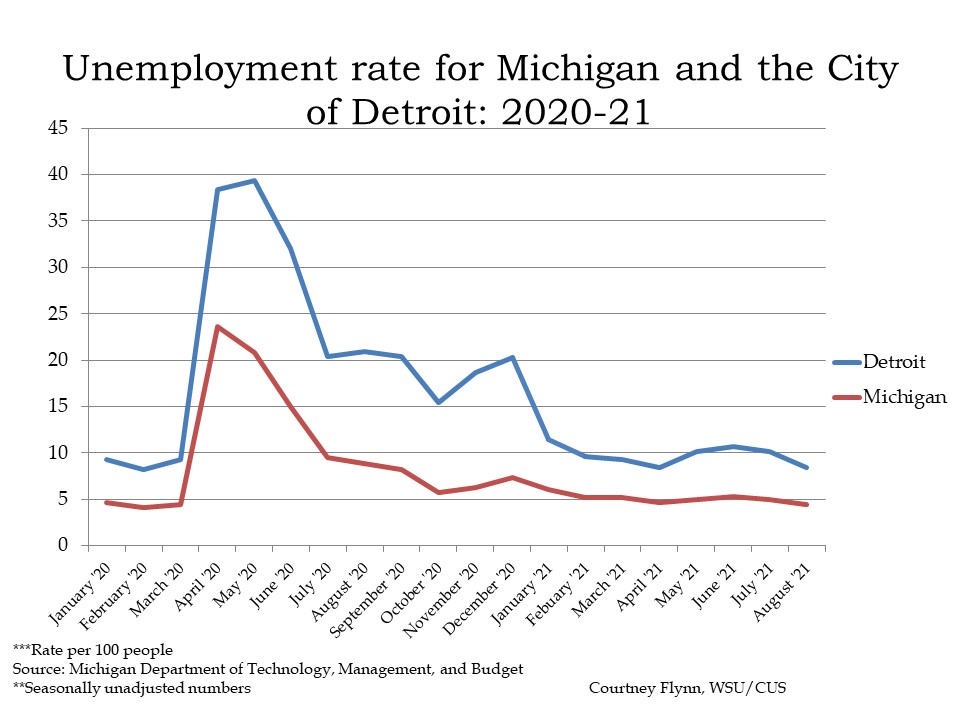
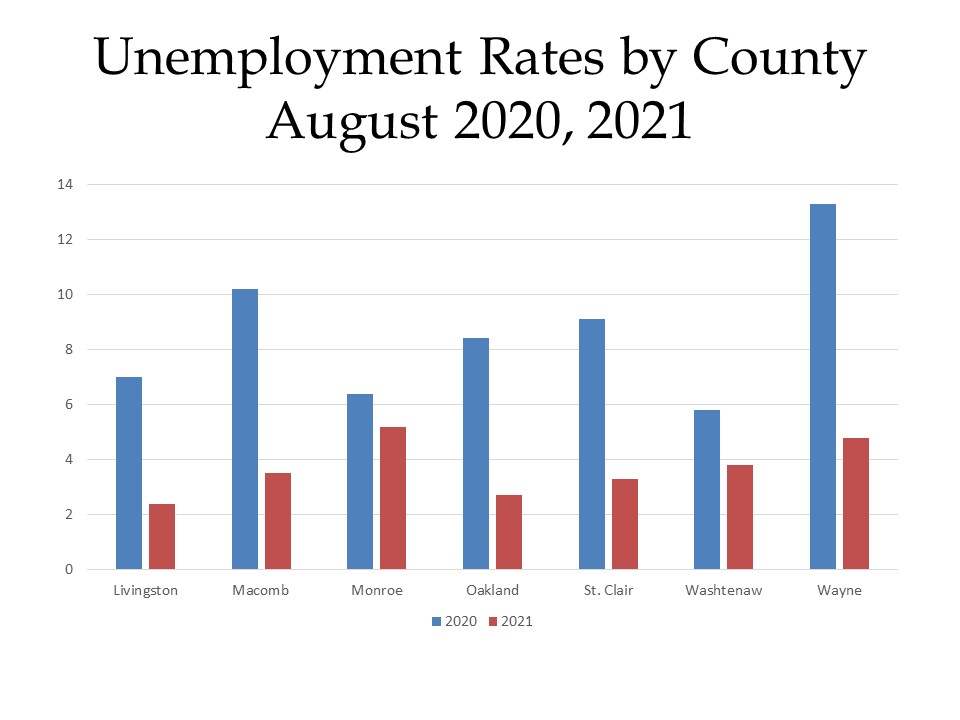
So, while there are signs of economic recovery of for small businesses there are still many needs for their future, and long-term success. Despite an unemployment rate of 6.1 percent in Michigan, there is still a need for employees. As we have discussed prior, living wages are means to attract employees, along with benefits that support employees’ physical and mental health. Navigating the supply chain is a much more difficult concept, as mega-retailers such as Amazon and Walmart continue to be leaders of the pack because of their buying power. However, this could lead to the argument that, given the opportunity, small businesses should fill their inventory with local goods—that is much easier said than done though. Locally made items are much different than items bought from a local store.
The issues surrounding the local economy can be complex, but we can all do our part and invest in small businesses in the holiday season, and year-round. Supporting local not only gives a local business and a local family a chance to survive, but it also strengthens the identity and success of a community.