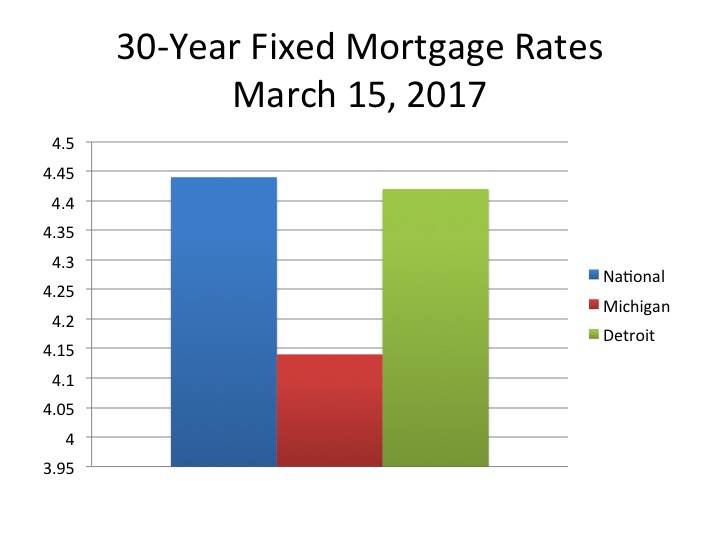
- The average 30-year mortgage interest rate in Detroit is lower than the national average (weekly);
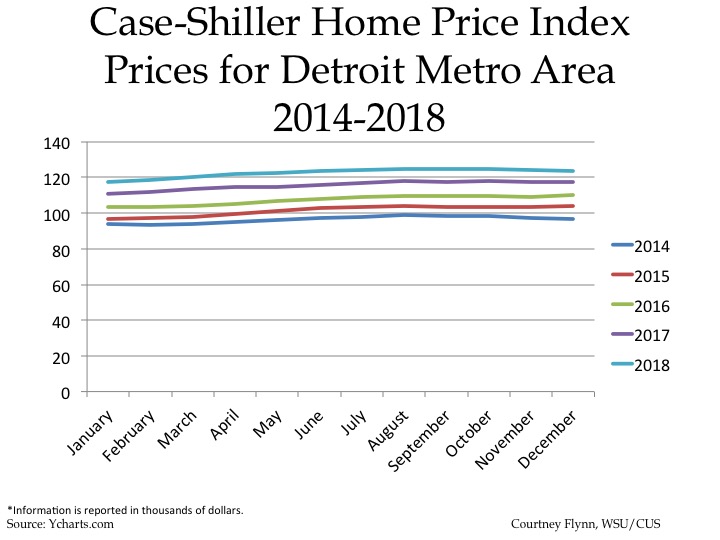
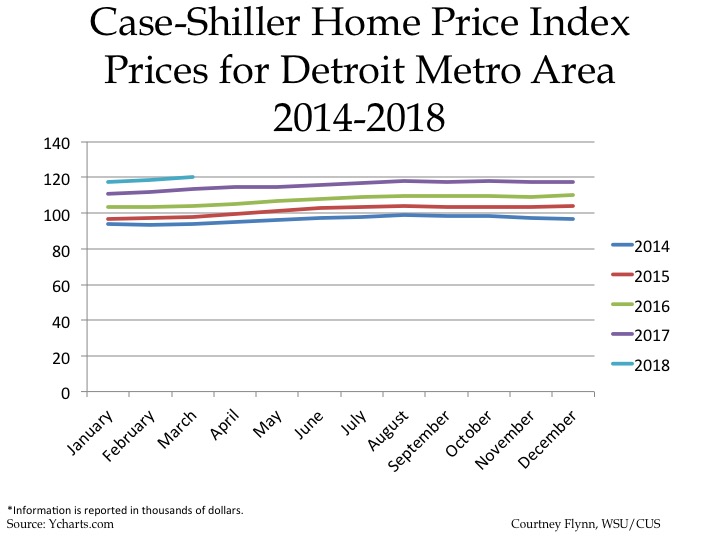
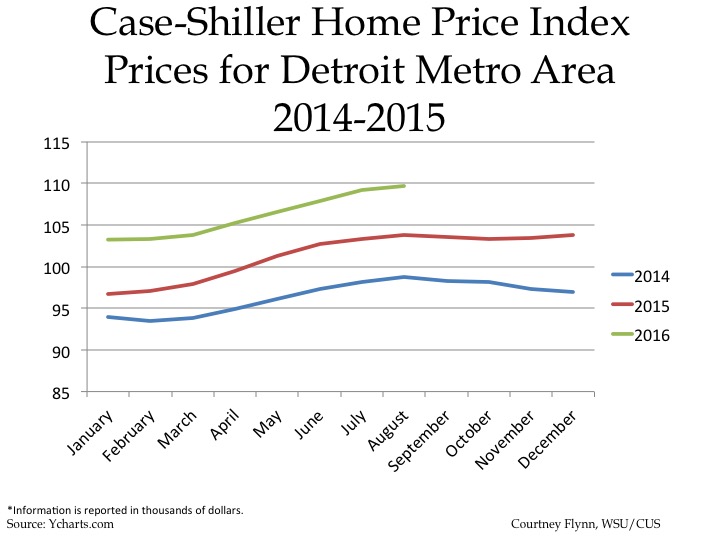
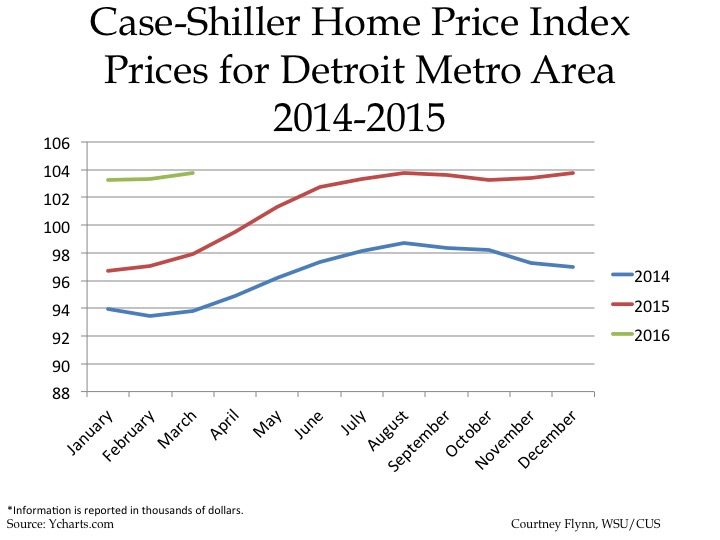
- The Standard and Poor’s Case-Shiller Home Price Index for the Detroit Metropolitan Statistical Area shows home prices continue to increase monthly and annually.
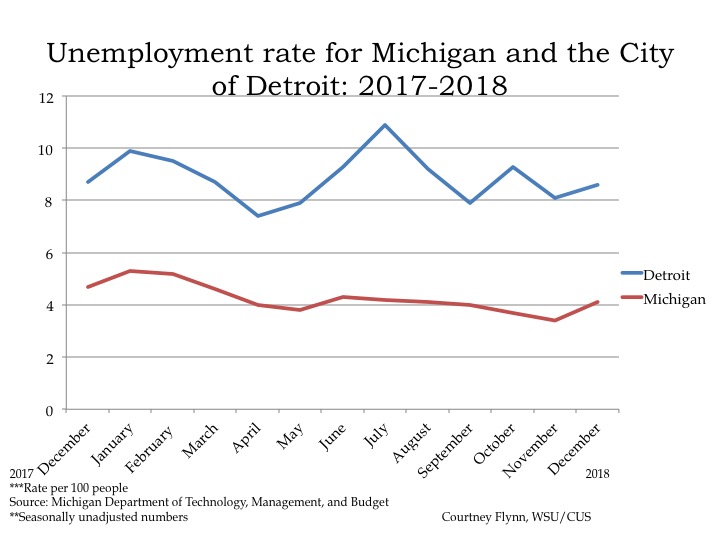
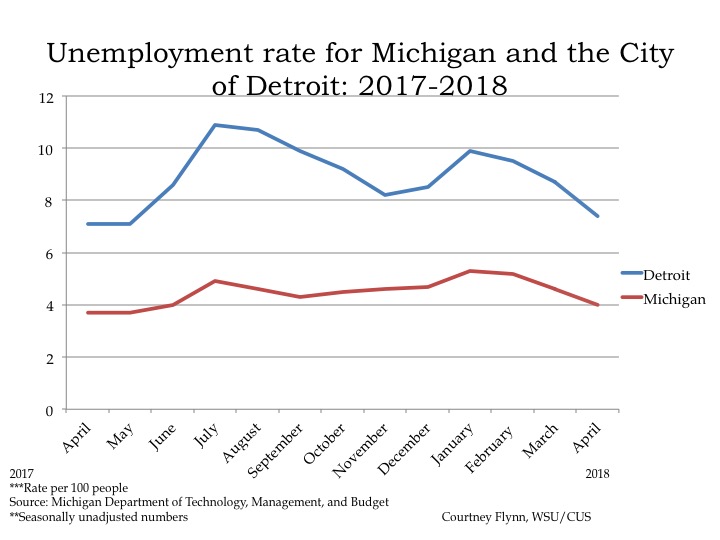
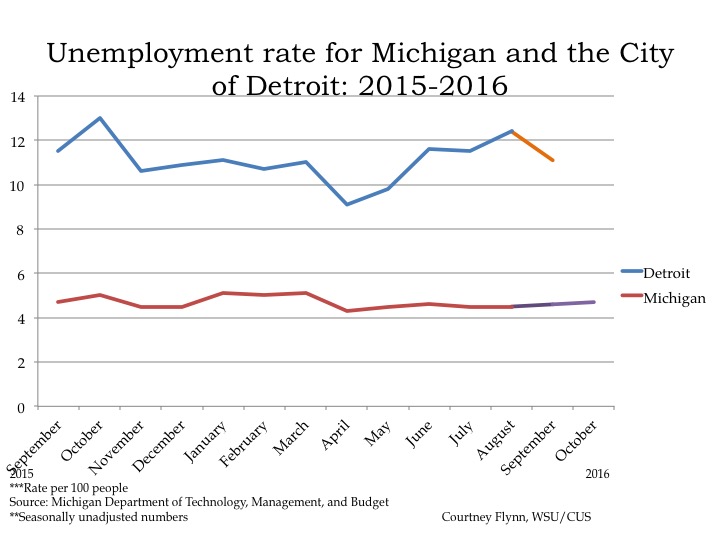
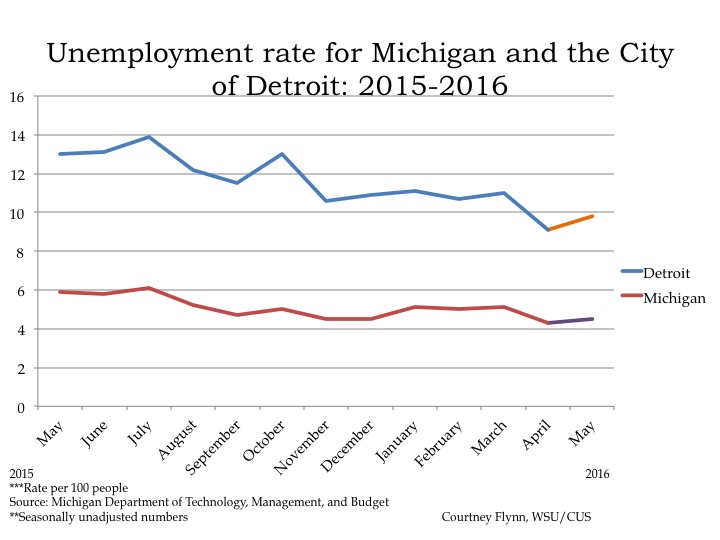
- The unemployment rate increased at the State and local level(monthly);
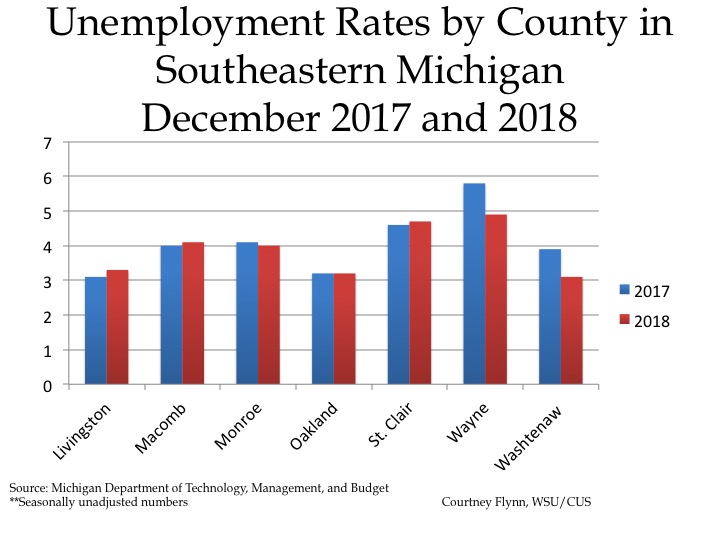
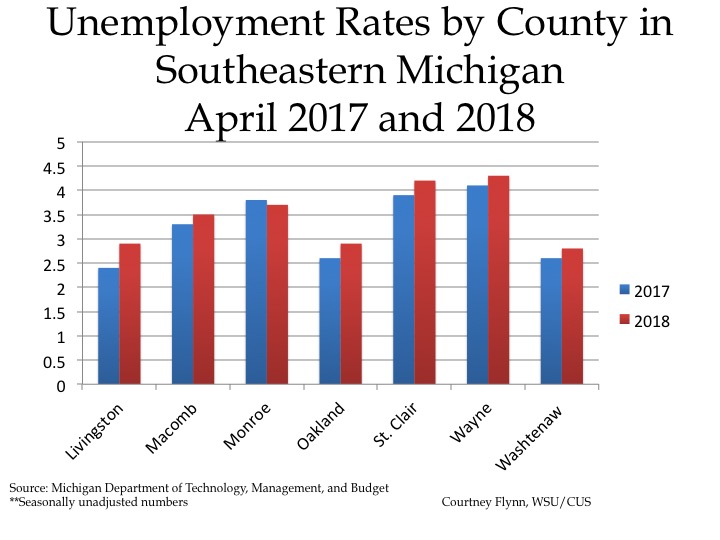
- Regionally, Washtenaw County’s unemployment rate remained the lowest;
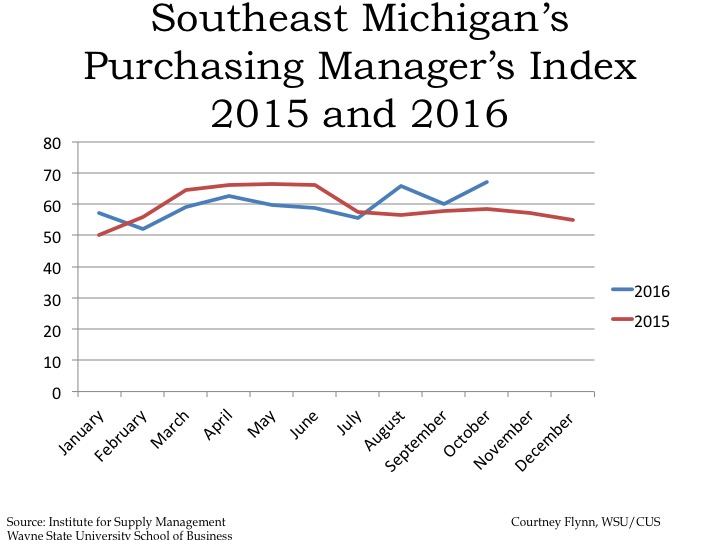
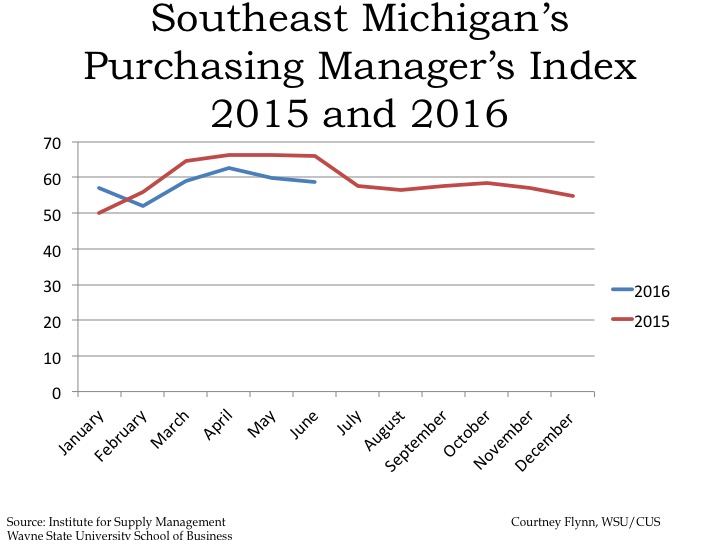
- The Purchasing Manager’s Index for Southeastern Michigan dropped below 50 but is expected to increase (monthly);
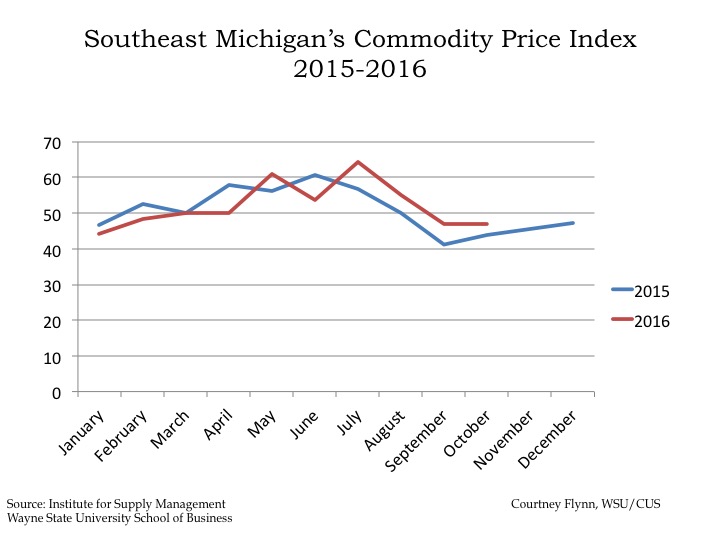
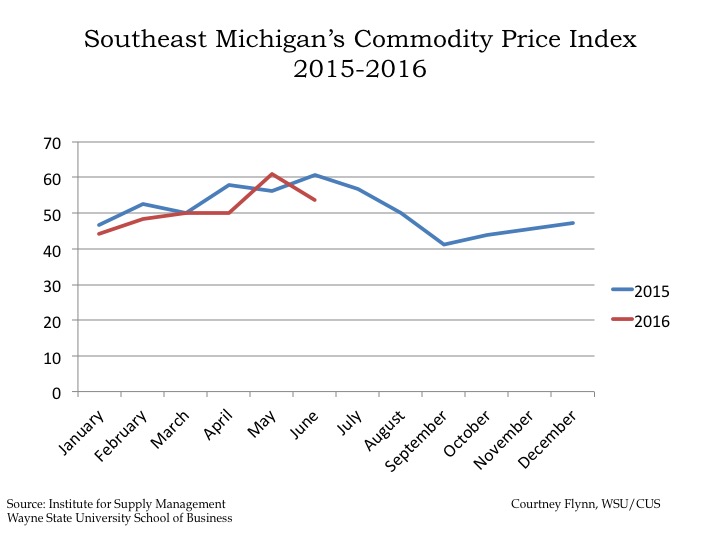
- The Commodity Price Index dropped to its lowest point in over a year (monthly);
On March 15, 2017 the Federal Reserve Raised the federal interest rate by .25 percent; it now ranges between .75 and 1 percent. This is the third time the rate has been raised since the financial crisis. Prior to last week rates were raised once in 2015 and once in 2016. The rate increase has been attributed to strong job growth, more investment from businesses into operations and a higher rate of consumer spending.
This rate increase will impact credit products, such as mortgages and auto loans, in addition to savings, home equity lines of credit and credit cards. Another item that may be affected is new home starts, a statistic that is not readily available through the Southeastern Michigan Council of Governments website, as it once was.
Above are three average 30-year mortgage interest rates at the national, state and local levels. These rates were provided by bankrate.com, which does a national survey of large lenders on a weekly basis. As a 30-year fixed rate mortgage is the most traditional type of home financing this was chosen to show the rate differences. The State of Michigan had the lowest average interest rate for the week of March 16 at 4.14 percent and the national average was the highest of the three at 4.44 percent. Detroit’s average 30-year fixed mortgage interest rate was 4.42 percent, which according to bankrate.com is an increase from the previous week. According to bankrate.com, Detroit’s rate for an average 30-year fixed mortgage rate in the Detroit area is equivalent to about an additional $4.50 a month on a mortgage for $165,000. Such an increase brings the average monthly payment to about $819.
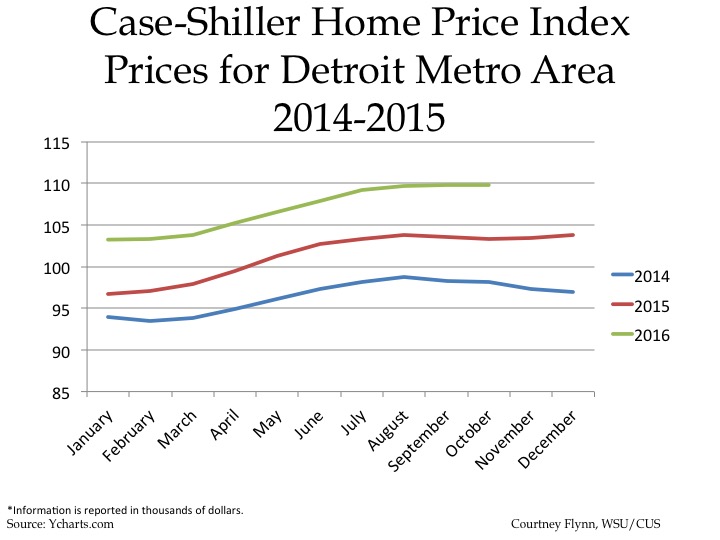
The above charts show the Standard and Poor’s Case-Shiller Home Price Index for the Detroit Metropolitan Statistical Area. The index includes the price for homes that have sold but does not include the price of new home construction, condos, or homes that have been remodeled.
According to the index, the average price of single-family dwellings sold in Metro Detroit was $109,790 in October 2016. This was an increase from $6,520 from October of 2015 and an increase from $11,570 from October of 2014.
**This information has not been updated since December of 2016. It was presented in a previous post, however due to the relation to the information above we are republishing it.**
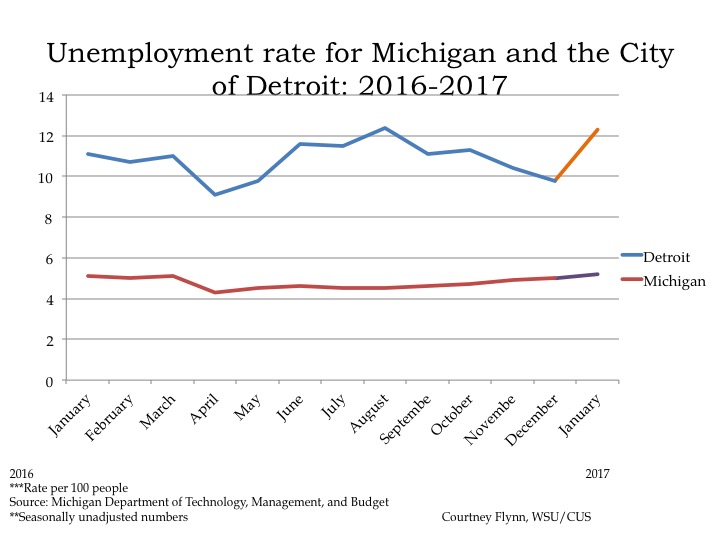
According to the most recent data provided by the Michigan Department of Technology, Management and Budget, the unemployment rate for the State of Michigan slightly increased to 5.2 in January of 2017 from 5 the previous month. Detroit, however, had a big increase. Unemployment in the City of Detroit increased from to 9.8 in December to 12.3 in January. The January unemployment rate for Detroit in 2017 was 1.2 points higher than it was the previous year at that time.
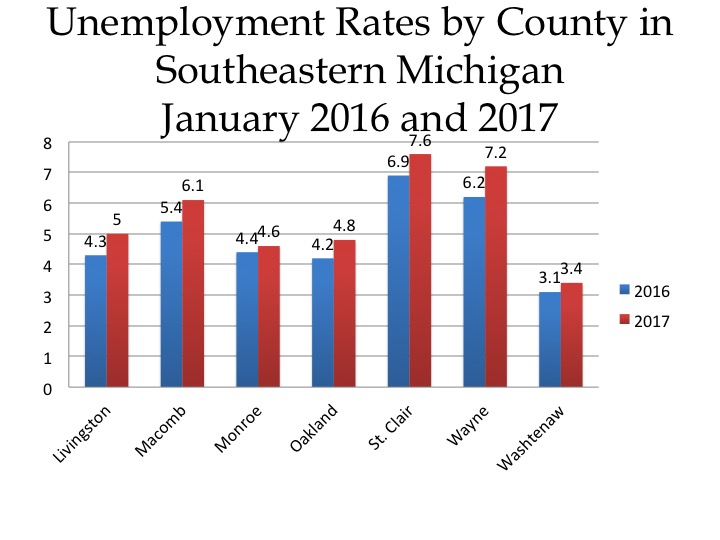
The chart above displays the unemployment rates for each of the seven counties in Southeastern Michigan for January of 2016 and 2017. For 2017, St. Clair County had the highest rate at 7.7 while Washtenaw County had the lowest at 3.4. St. Clair and Wayne counties were the only two in the region with unemployment rates above 7 in January. Four of the seven counties (Livingston, Monroe, Oakland and Washtenaw) all had unemployment rates at or below 5.
While in 2016 St. Clair County again had the highest unemployment rate for the month of January, regionally, and Washtenaw County had the lowest, it is interesting to note that unemployment rates were higher across all counties in 2017. Wayne County had the largest difference between 2016 and 2017 at 1 point; the unemployment rate was 6.2 in 2016 and 7.2 in 2017.
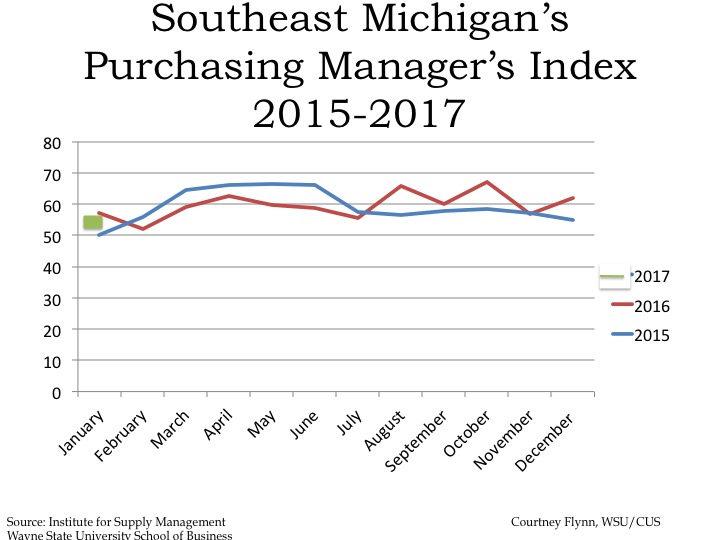
The Purchasing Manger’s Index (PMI) is a composite index derived from five indicators of economic activity: new orders, production, employment, supplier deliveries, and inventories. A PMI above 50 indicates the economy is expanding.
According to the most recent data released on Southeast Michigan’s Manager’s Index, the PMI for December 2016 was 53.3, a significant drop from an index of 61.9 the prior month. History shows though that January traditionally has a lower PMI readings and it is expected to increase for February.
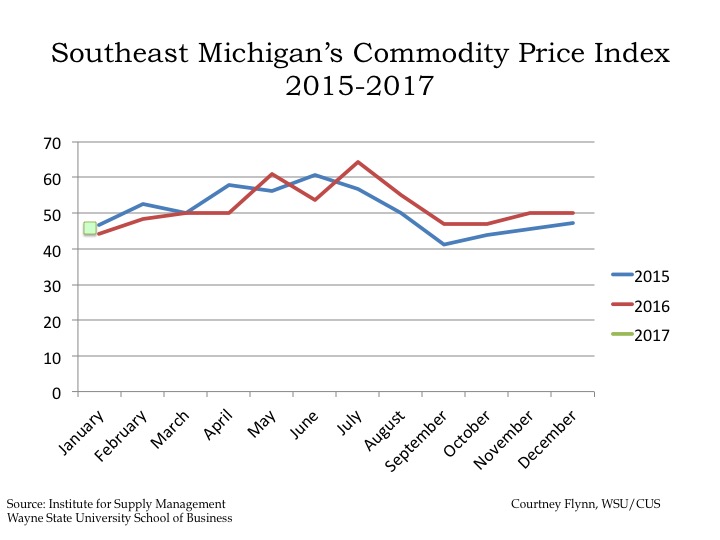
The January 2017 Commodity Price Index dropped to the lowest it has been since September of 2015. At that time the Commodity Price Index was 41.2 and this most recent reading was 41.7. There is speculation from the Institute of Supply Management-Southeastern Michigan that this drop could reflect policy changes from the new federal administration, especially as gas and oil prices are up.