In 2019, before COVID, the average American spent 28 minutes commuting to, or from, their job; in Michigan that average was 25 minutes. However, once the pandemic hit many of us began working from home, which directly impacted mobility to and from workplaces and commute times, presumably. According to a Feb. 23, 2021 report from Google, mobility to places of work in the State of Michigan have declined by 29 percent. At a regional level in Southeastern Michigan mobility has declined even more than the state average since last March. According to the data, mobility declined by the following percentages for the seven counties in Southeastern Michigan from the pre-pandemic baseline:
Livingston County: 31 percent
Macomb County: 33 percent
Monroe County: 22 percent
Oakland: 41 percent
St Clair County: 15 percent
Washtenaw County: 49 percent
Wayne County: 35 percent
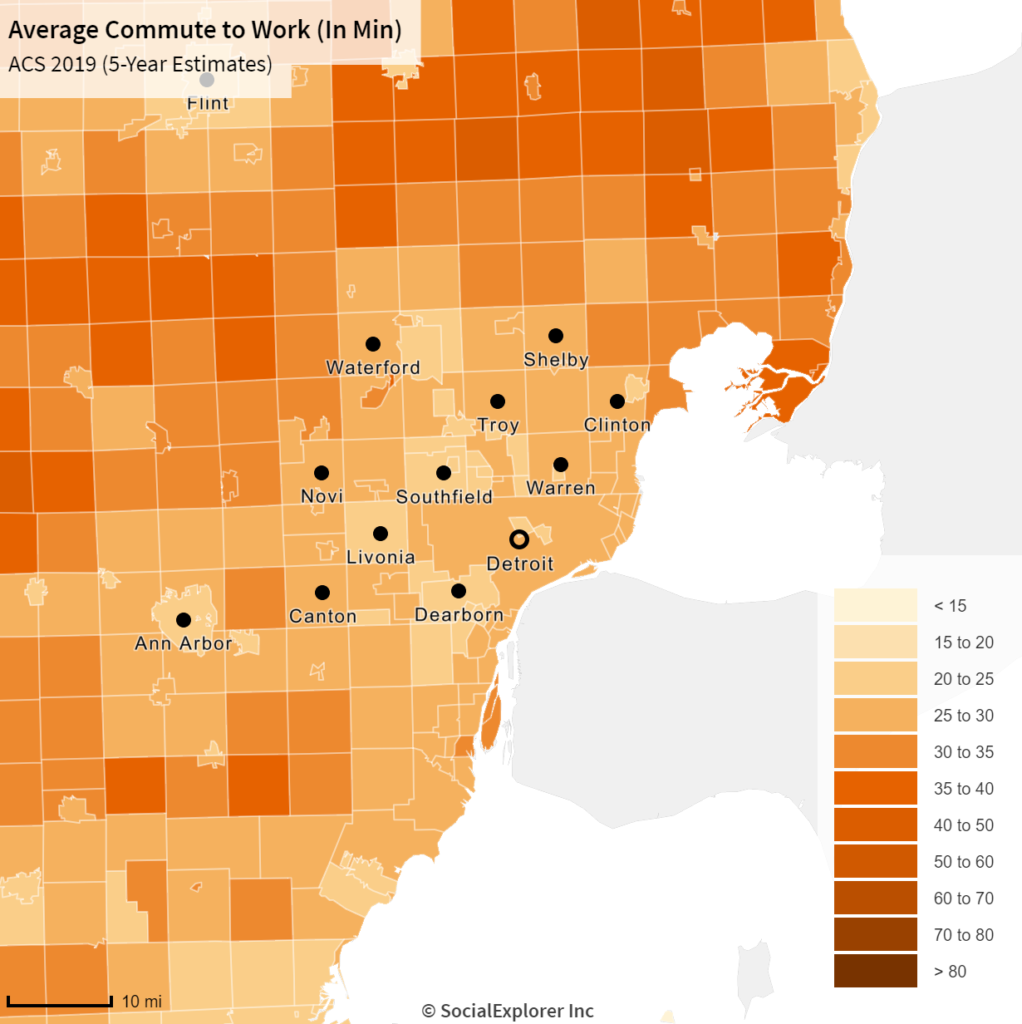
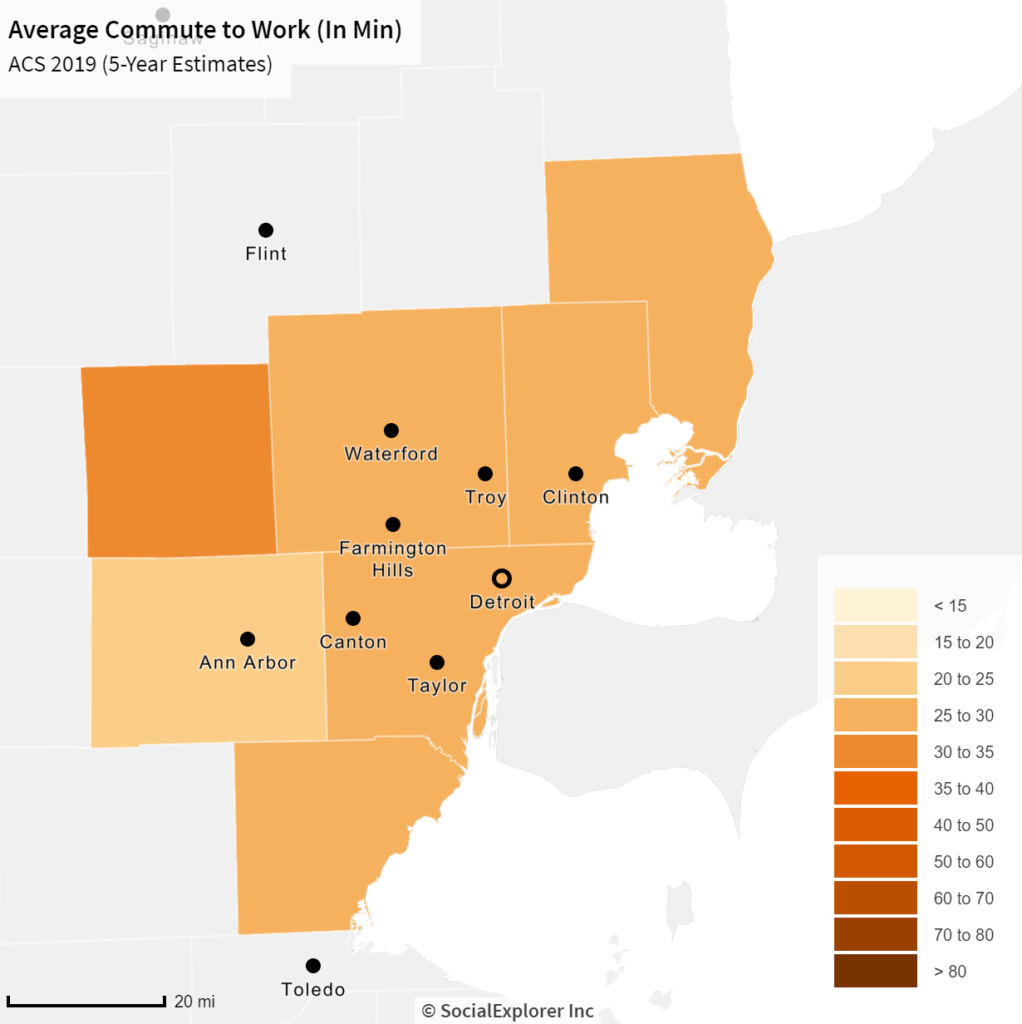
While mobility data differs from commute data, the fact that people are going to work less means commute times will also decline. Below are two maps showing the average work commute times in 2019 at the municipal and county levels.
In 2019, the City of Ann Arbor had the lowest average commute time at 20 minutes, according to the American Community Survey, and Clay Township had the highest average commute time at 37 minutes. At the county level, Washtenaw County (where Ann Arbor is located) had the lowest average commute time at 24 minutes and Livingston County had the highest average commute time at 33 minutes.
When the 2020 commute data is available it will be interesting to see just how many minutes the average commute time declined in Southeastern Michigan, and if that trend lasts for the long-term. Declined commute times and mobility to and from places of work means several things, including less automobile pollution and more time for individuals to participate in leisure activities, perform additional work, do chores or anything else that may be of interest to them.
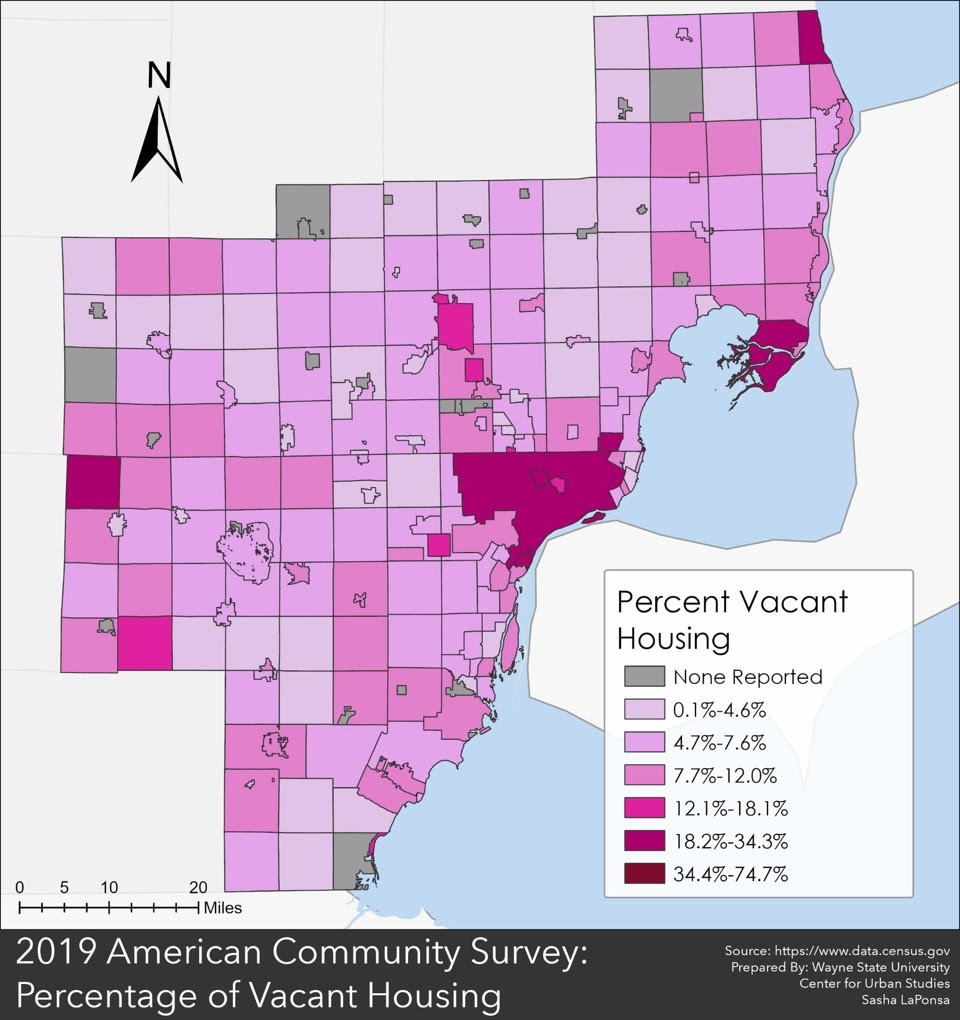
In 2019, Highland Park had the highest vacancy rate in Southeastern Michigan at 34 percent, according to the American Community Survey; the vacancy rate is the percentage of all available units in a rental property, such as a hotel or apartment complex, that are vacant or unoccupied. Clay Township (St. Clair County) had the second highest vacancy rate at 30 percent and Detroit had the third highest rate at 27percent. There were only seven communities in the region with vacancy rates at or above 20 percent; of those communities four were Detroit or an inner-ring suburb (Highland Park, River Rouge and Eastpointe) and the remaining three were outer-ring suburbs (Clay, Burtchville and Lyndon townships). While there were a handful of outer-ring suburbs with high vacancy rates, those with the lowest vacancy rates were all outer-ring suburbs. Orchard Lake Village had the lowest vacancy rate in 2019 at 1.4 percent, followed by Clarkston at 1.6 percent and Plymouth and Augusta townships at 1.8 percent. The inner-ring suburb with the lowest vacancy rate was Southfield Township at 4.1 percent, followed by Allen Park at 4.9 percent.
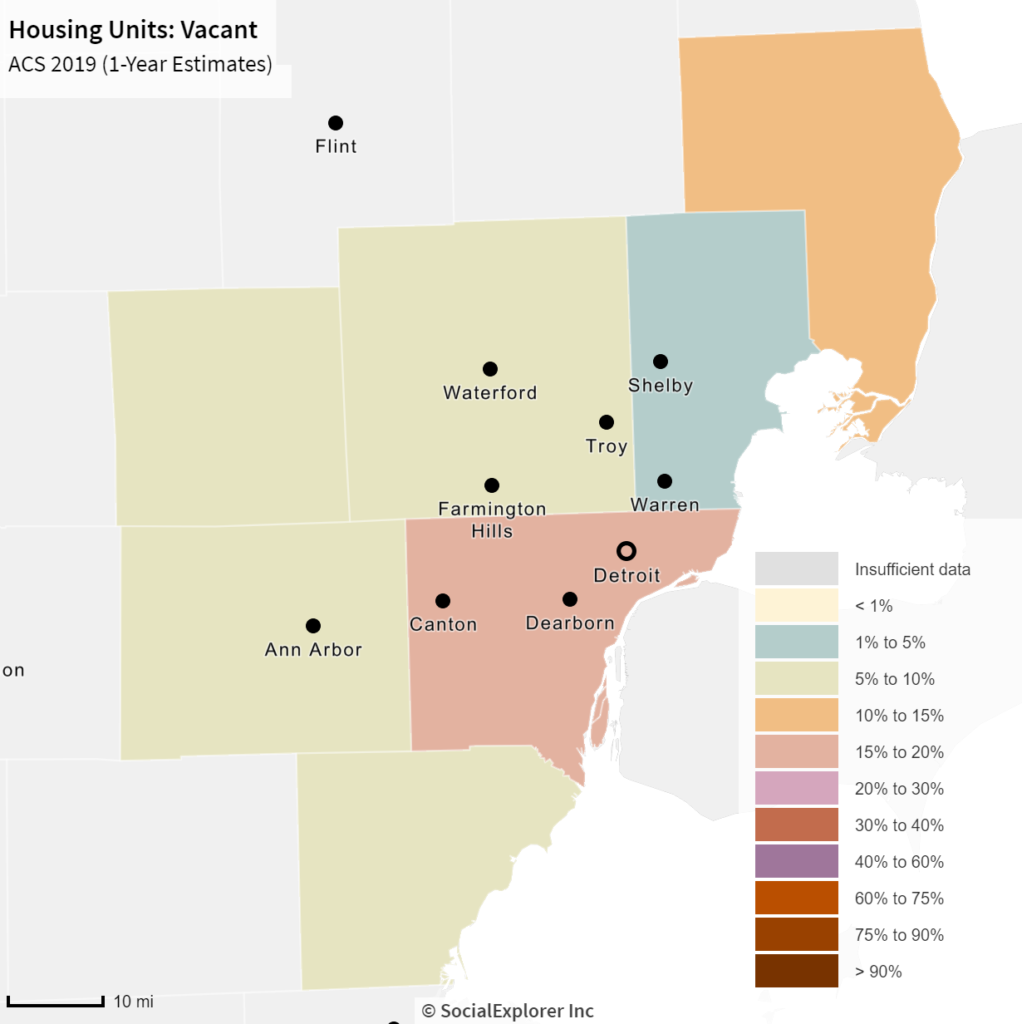
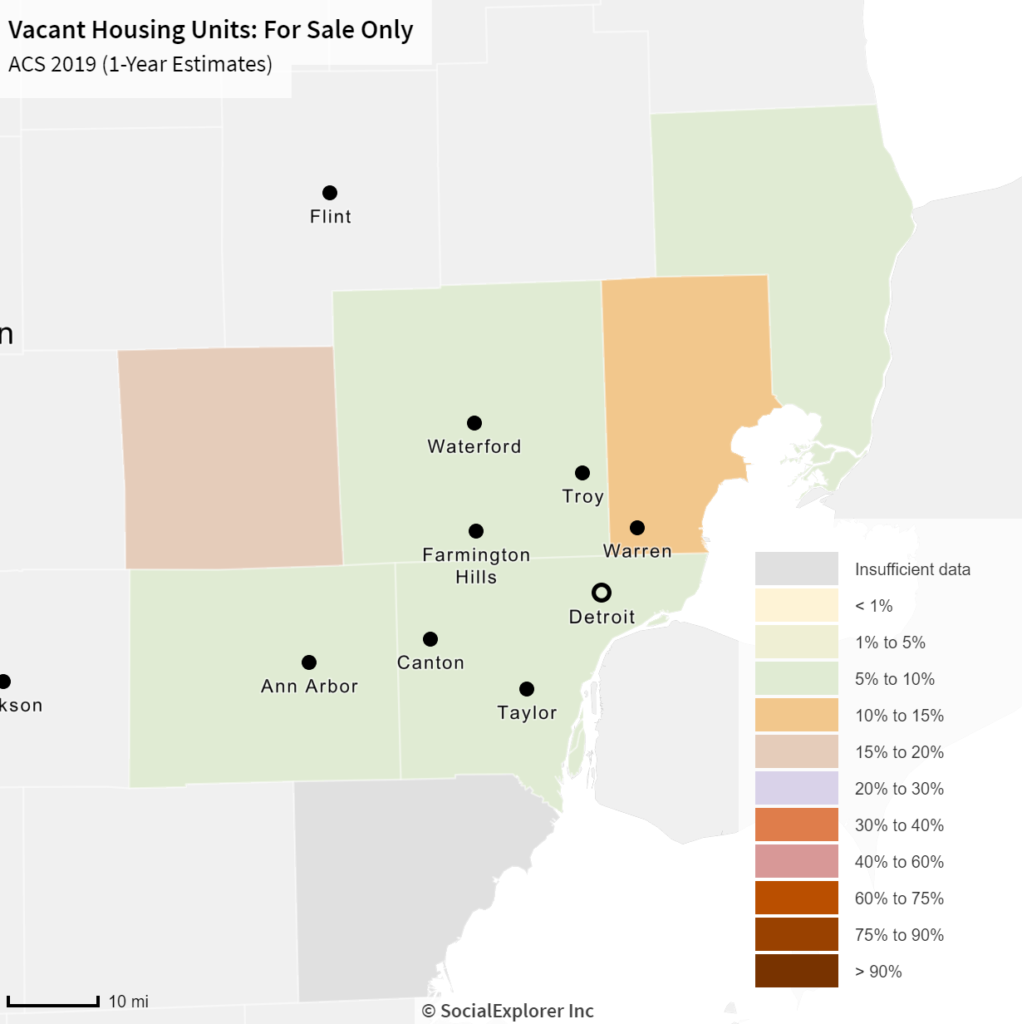
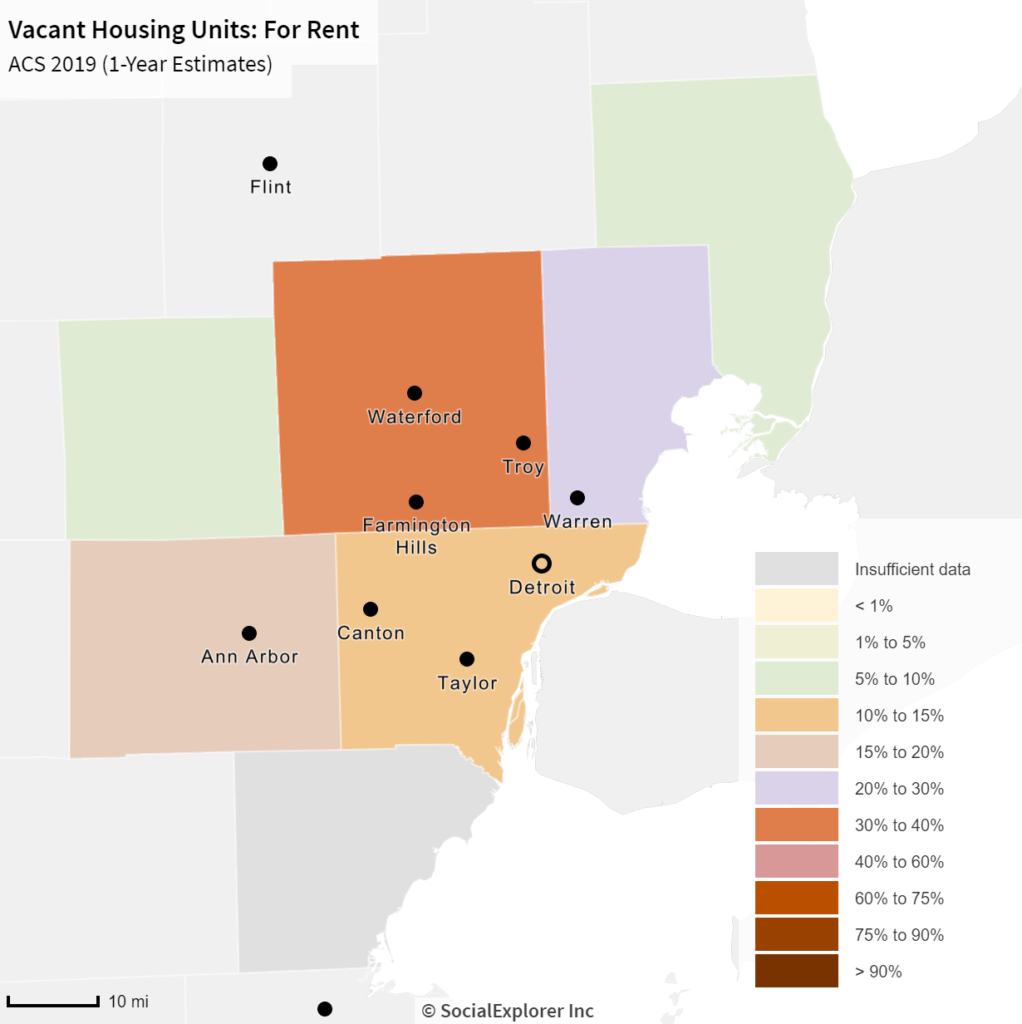
In knowing that the Detroit inner-ring suburbs had among the highest vacancy rates in the region, it is not surprising that Wayne County had the highest vacancy rate at the county-level at 15.5 percent. However, St. Clair County had the second highest vacancy rate at 12 percent; St. Clair County is home to the community with the highest vacancy rate (Clay Township). When breaking down the type of vacancies that makeup each county’s overall percentage though Wayne County did not rank the highest amongst any of the categories. The breakdown of vacancy types-housings units for sale, housings units for rent and “other” (described below)-is only available at the county level. So, while we cannot fully understand the specifics of vacancy rates at the municipal level, the county data does give us some insight.
According to the data, Livingston County had the highest percentage of vacant homes for sale at 18 percent, followed by Macomb County at 14 percent and then Wayne County at 10 percent. For rental vacancies, Oakland County had the highest percentage at 31 percent and Macomb County at 26 percent; Wayne County had an 11 percent vacancy rate for rentals. Overall we see that rental units tend to have higher vacancy rates than homes for sale; the rental vacancy rate may grow even higher in areas such as Detroit where demand for rentals is down just as new apartment buildings are opening, according to the Detroit Free Press.
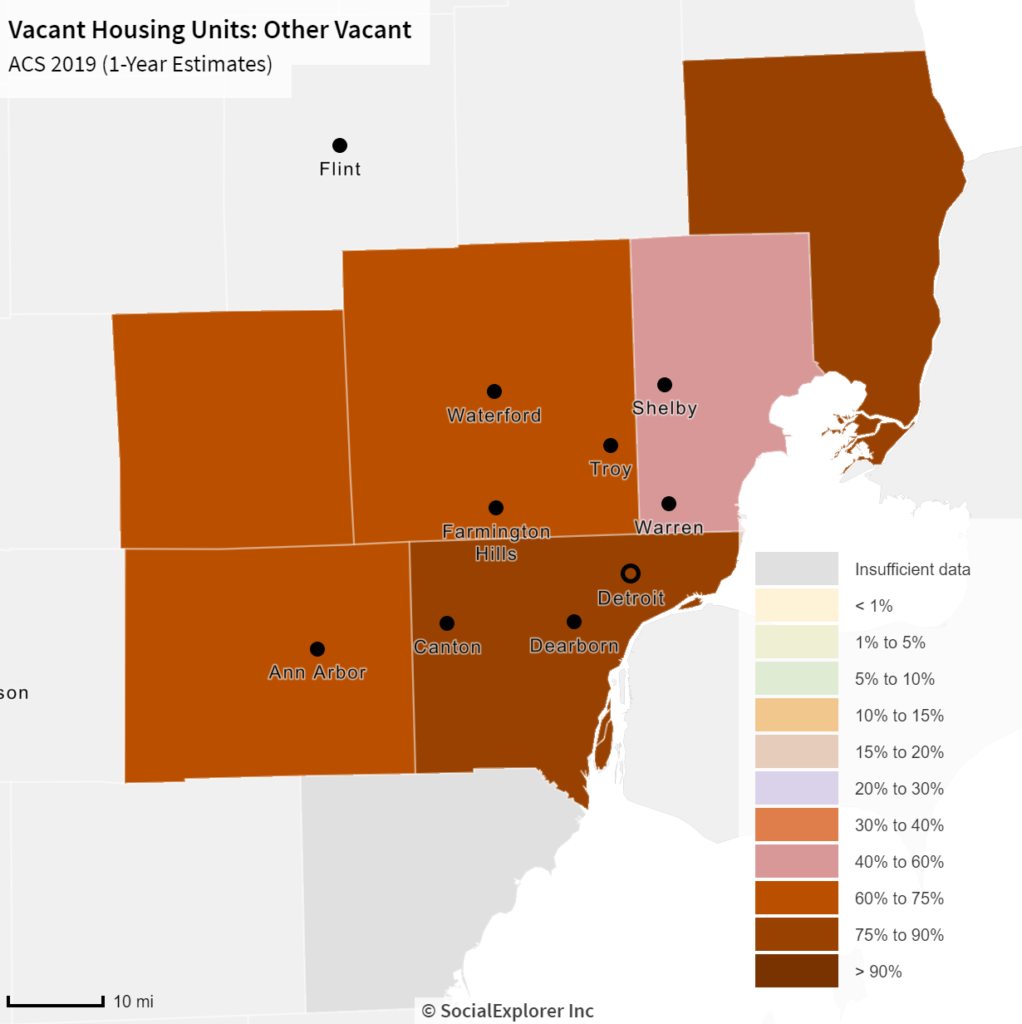
A property is labeled as “other” vacant by the U.S. Census Bureau when it does not fit into one of the categories discussed above. According to the U.S. Census Bureau “other” properties are typically vacant because the owner does not want to rent or sell it; it is being used for storage; the elderly homeowners are living in a nursing home; it’s in an estate settlement; it is being repaired or renovated or it is in foreclosure. According to the data at the County level, St. Clair County had the highest percentage of “other” vacant properties (as described above) at 88 percent, followed by Wayne County at 79 percent. Macomb County had the lowest percentage at 60 percent. This data was only available at the county level.
While the breakdown of vacancy rates is only available at the County level it does shed some light on why certain communities may have some of the highest vacancy rates. For example, we know that communities such as Highland Park and Detroit have higher vacancy rates due houses being abandoned and people leaving those cities for outer-ring suburbs. Furthermore, according to Next Gen City, the highest vacancy rates are in areas that have the highest population of black residents; Detroit and Highland Park have the highest black populations in the State of Michigan. As the COVID-19 pandemic continues to affect the economy it will interesting to see how vacancy rates change in the future.
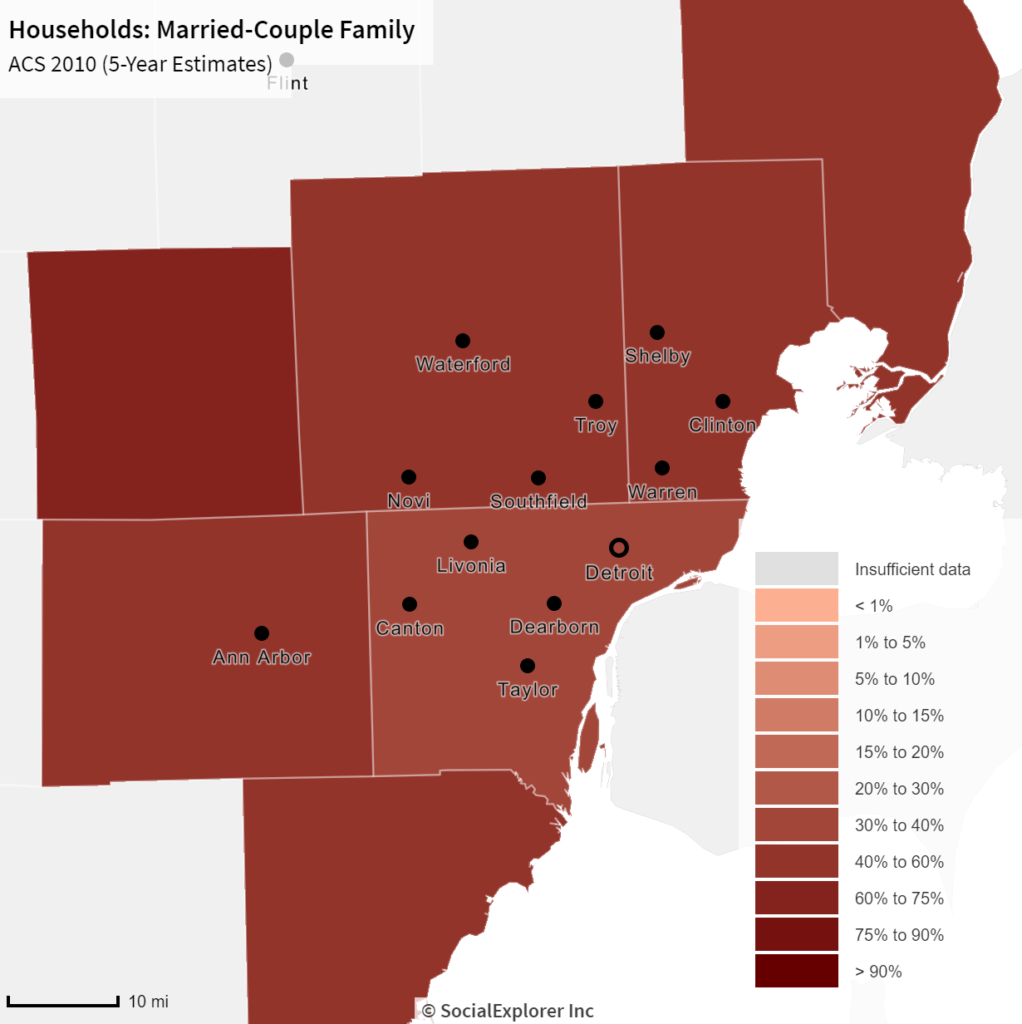
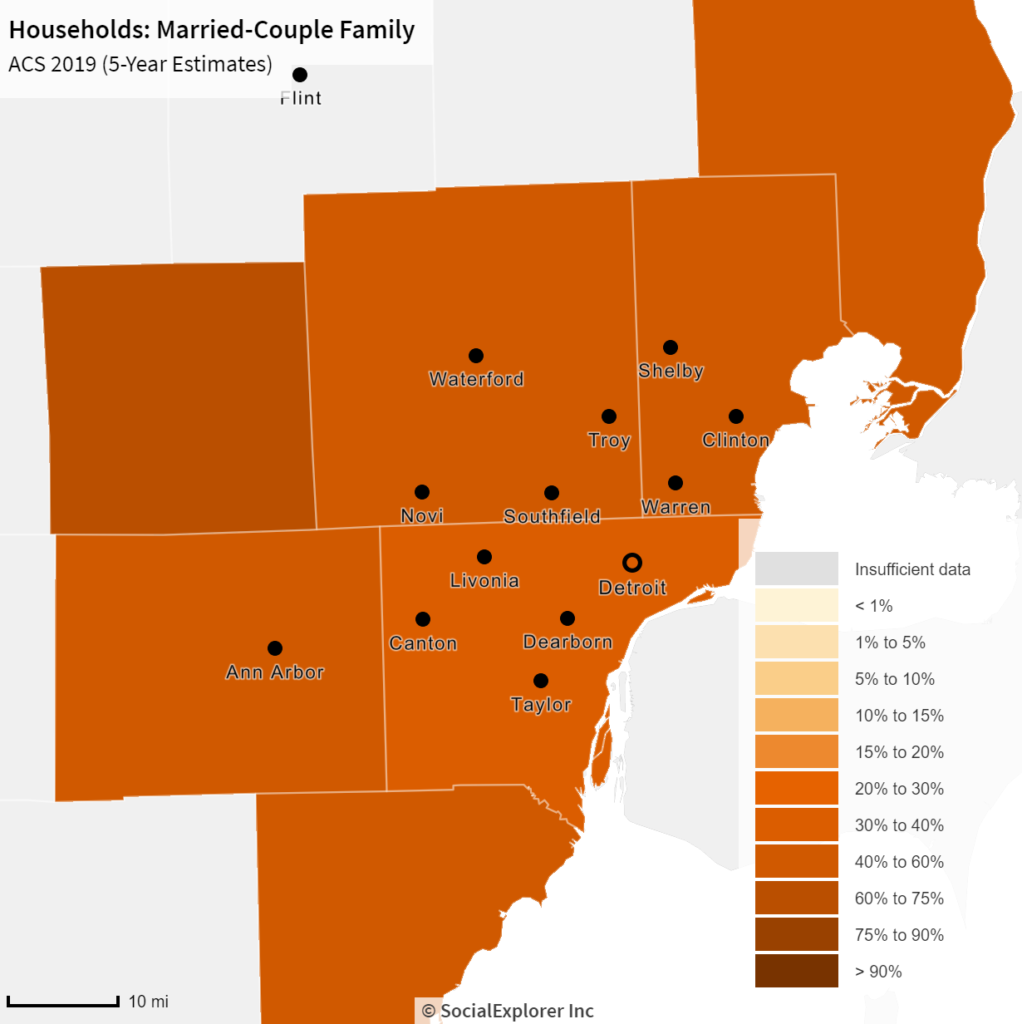
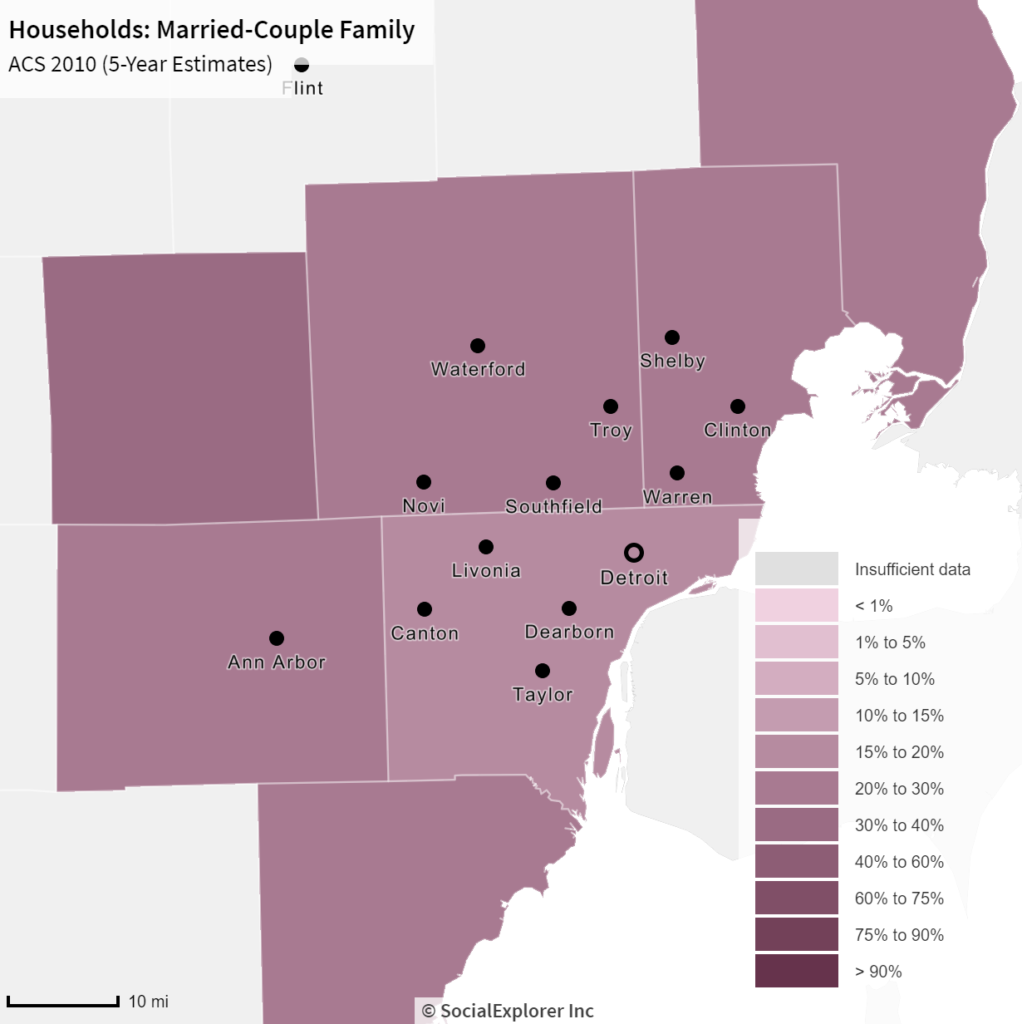
The day of love just passed, and data shows the tradition of marriage may be becoming a thing of the past too. According to the 2019 American Community Survey fewer people were married in 2019 in Southeastern Michigan than in 2010.
As shown in the first map below, compared to the second map, each of the seven counties in the region had a lower percentage of married individuals in 2019, with Wayne County having the lowest percentage of married individuals. In Wayne County, 39 percent of the population was married in 2010, and by 2019 that percentage had dropped to 36 percent. Livingston County had the highest percentage of married individuals. In 2019 61 percent of the population in Livingston County was married, and in 2010 64 percent of the county was married. Monroe County experienced the largest decline between 2010 and 2019; in 2010 58 percent of the population was married, and in 2019 that decreased to 53 percent.
Declining marriage rates have been a trend for nearly two decades now, and this is likely due to economic and social trends. According to the Brookings Institute, as marriage rates decline, non-marital births, cohabitation and single parenthood have all been increasing. Furthermore, education and income levels also play a role in current marriage trends. For example, those with at least a bachelor’s degree are more likely to get married than those without such a degree, according to the Brookings Institute. Additionally, marriage rates are declining the most in the middle class. Potential reasons for such declines include economic instability for both men and women, wage inequalities and the concern over the cost of children.
In addition to the percentage of people getting married declining, so is the percentage of married individuals with children. Between 2010 and 2019 each county in Southeastern Michigan experienced a decline in the percentage of married couples with children under the age of 18 in the house. In both 2010 and 2019 Livingston County had the highest percentage of married individuals with a child; in 2010 that percentage was 30 percent, and in 2019 that percentage was 24 percent. Wayne County had the lowest percentage of married individuals in 2010 and 2019 at 18 percent and 15 percent, respectively. Monroe County experienced the largest decline of individuals married with children; in 2010 25 percent of individuals were married with at least one child under the age of 18, and by 2019 that declined 15 percent.
Overall, the data shows that we as a society are moving away from the traditional idea of love, marriage and a baby. As mindsets have shifted, so have economic conditions. What is in store for the tradition of marriage and a family remains unknown post-pandemic.
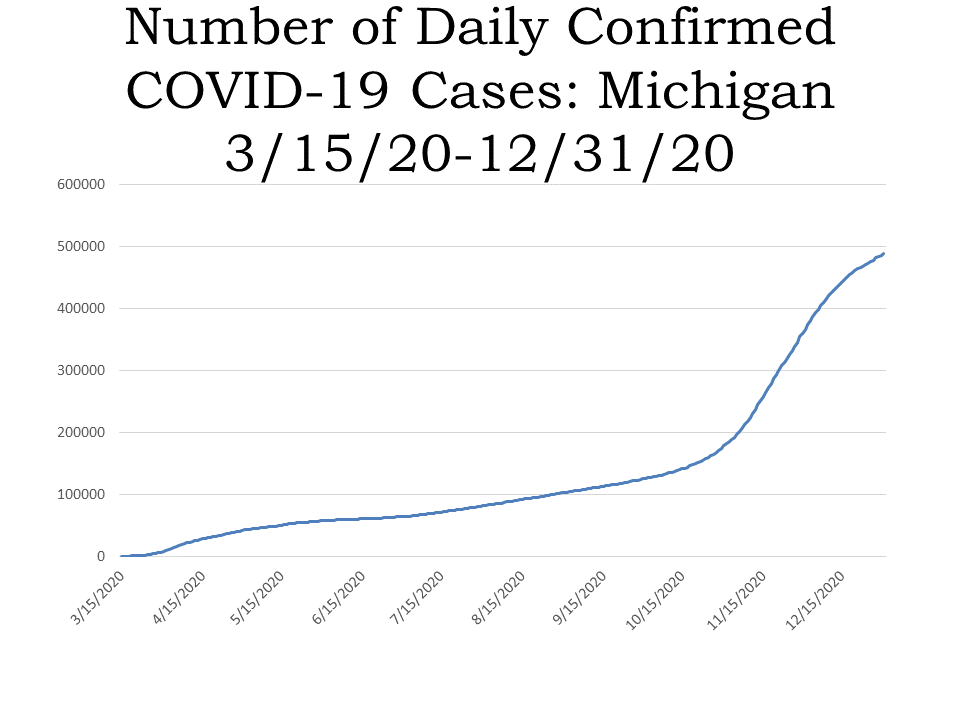
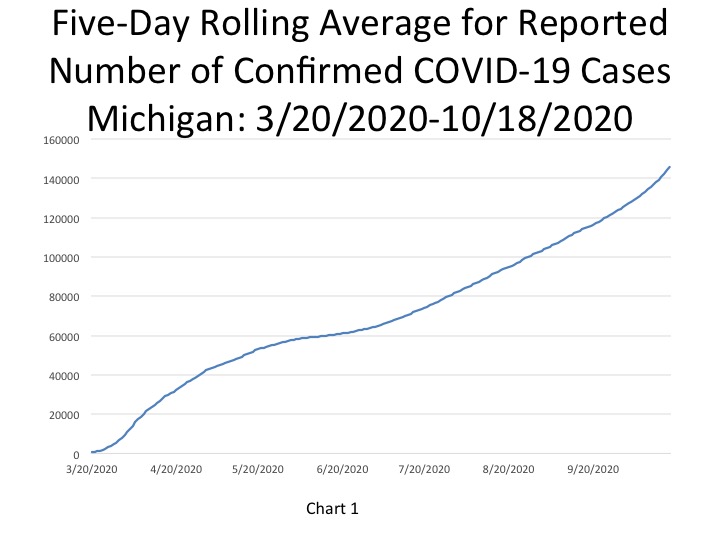
Twenty-twenty may be a wrap but the COVID-19 pandemic continues on and the economic impacts continue to be felt, nationally and locally. According to the Michigan Department of Health and Human Services, on Jan. 2, 2021 there were 497,127 confirmed COVID-19 cases; that is 8,983 new confirmed cases since Dec. 29, 2020 (the State did not release data over the New Year’s holiday). According to the five-day rolling average (shown in the chart below) there were 489,096 confirmed COVID cases in Michigan on Dec. 31, 2020. New case numbers continue to remain in the thousands, and while the vaccine is in its first phase of distribution, we still have a ways to go until the affects of this virus—physically, economically, socially and mentally—are no longer felt.
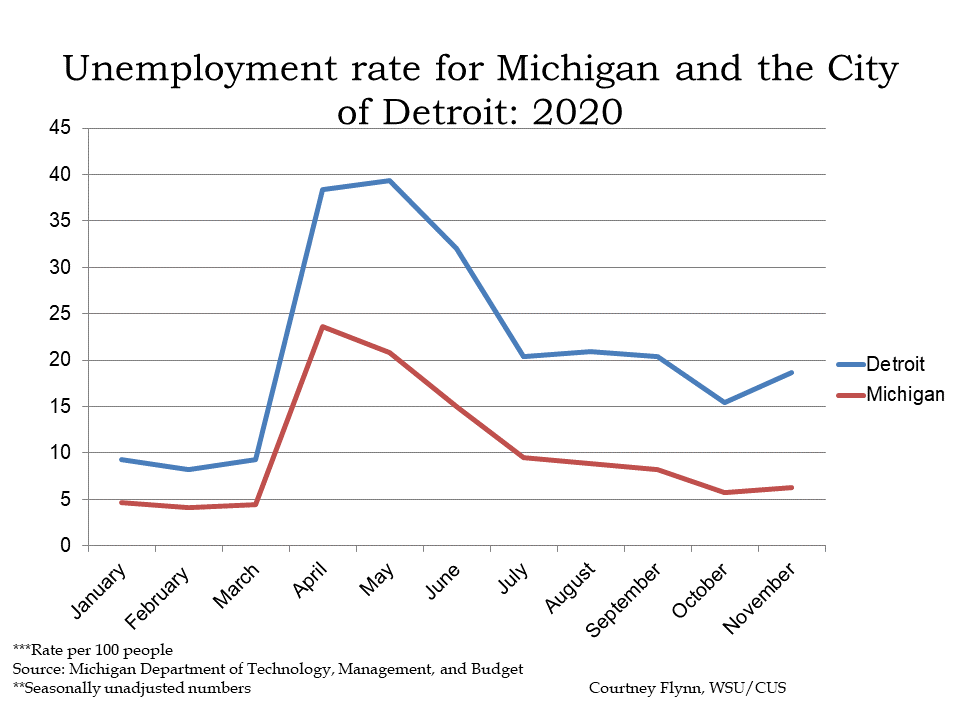
In November of 2020 the unemployment rates for the State of Michigan and for the City of Detroit increased after general declines between July and October. The State of Michigan reported an unemployment rate of 6.3 in November, a higher rate than what was reported in October, which was 5.7—the lowest rate reported since the pandemic began. While the November unemployment rate was still lower than what was reported between April and September of 2020, it was still an increase from October and likely a reflection of the stronger COVID-19 restrictions imposed by the State and growing caution from citizens as the confirmed case numbers began to rapidly increase.
For the City of Detroit, the unemployment rate for November of 2020 was 18.7, which is higher than the October rate of 15.4. While Detroit’s unemployment numbers remain much higher than what they were a year ago and above the State’s, the city is following the same trend as the State. Furthermore, the November unemployment data shows how the unemployment gap between the State and Detroit continues to grow wider as the case numbers increase.
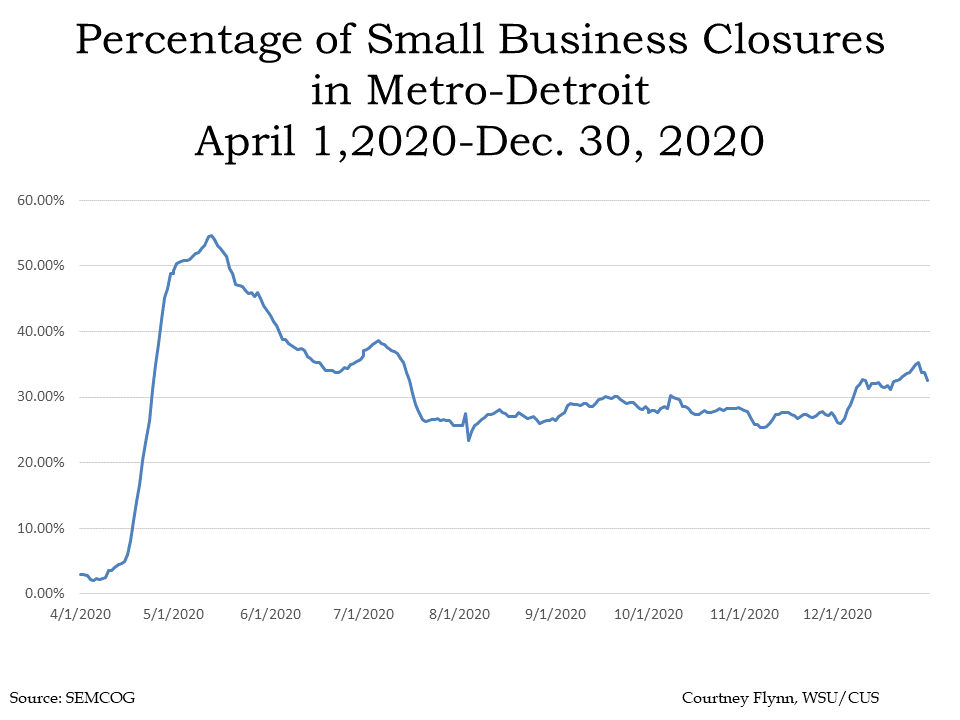
A direct reflection of the unemployment data above is the number of small business closures. According to the Southeastern Michigan Council of Governments (SEMCOG), 33 percent of small businesses in Metro-Detroit closed as of Dec. 30, 2020. While this lower than the May 12, 2020 local small business closure percentage of 54 it is still far above the 3 percent closure rate on April 1, 2020—less than a month after COVID hit Michigan.
The data on the percentage of small business closures is determined through the Opportunity Insights Economic Tracker. This source uses credit card transaction data from 500,000 small businesses and estimates closures from the number of small businesses not having at least one transaction in the previous three days. The data covers industries such as healthcare services, leisure and hospitality, and retail and transportation.
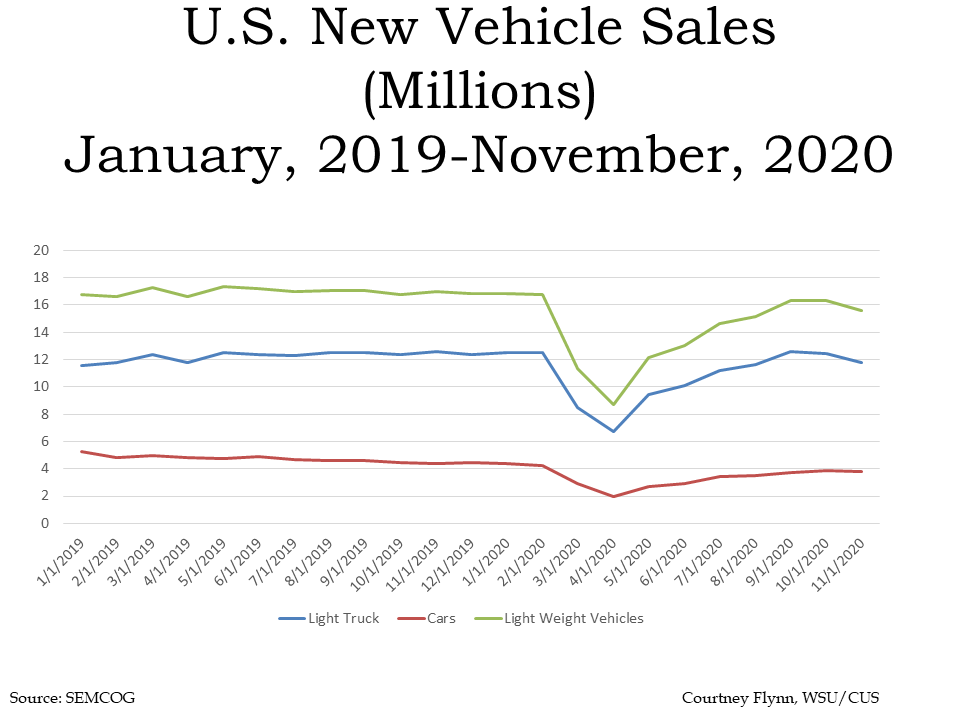
Michigan’s economy continues to rely heavily on the auto industry and between February and March of 2020 auto sales for cars, trucks and light weight vehicles were cut in half. Since then, the number of auto sales has slowly, yet steadily, grown—but not to pre-pandemic levels. In November of 2020 auto sales for: light weight vehicles was 15.5 million, compared to 16.9 million the year prior; light truck sales was 11.8 million compared to 12.6 million in November of 2019; car sales was 3.8 million, compared to 4.4 million the year prior. All three types of vehicles have experienced a decline, with light weight vehicles experiencing the largest decline when comparing 2019 sales to present sales.
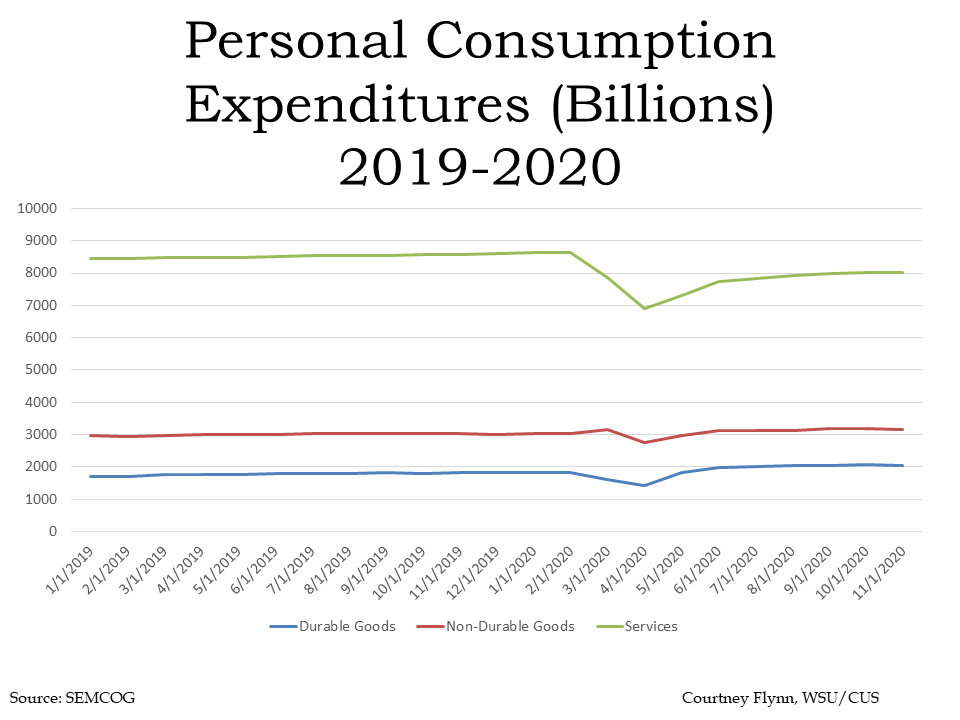
Below shows the consumption expenditures of goods in the U.S. between 2019 and 2020. According to the U.S. Bureau of Economic Analysis, durable goods have an average useful life of at least 3 years (e.g. motor vehicles) while nondurable goods have an average useful life of less than 3 years (e.g. food) and services are commodities that cannot be stored or inventoried and are consumed at the time of purchase (e.g., dining out). The chart below shows how in March of 2020 consumption of nondurable goods increased while consumption of durable goods and services decreased. Following the initial panic of the COVID-19 pandemic, consumption expenditures of nondurable goods decreased in April, 2020 and have since somewhat leveled off. In November of 2020 $3167 billion in nondurable goods was consumed and in November, 2019 $3017 billion in nondurable goods was consumed. Overall, there has been an increase in consumption expenditures of nondurable goods since last year. For durable goods, $1813 billion was consumed in November of 2020 and in November of 2019 $2032 billion was consumed; this shows an overall decrease.
Services have been the hardest hit in terms of expenditure consumption. In November of 2020 $8014 billion in services was consumed and in November of 2019 $8589 billion was consumed.
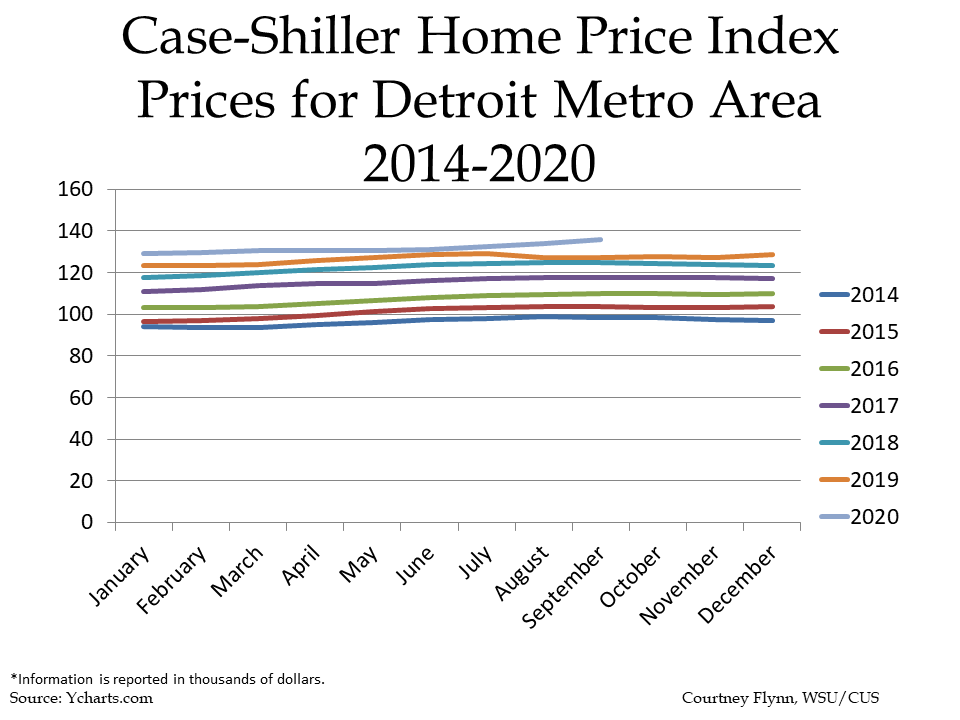
In addition to COVID impacts on employment rates and consumption of goods and services, it has also impacted the sale prices of homes. However, the pandemic seems to have had the opposite effect—home prices have continued to increase.
According to the Case-Shiller Home Price Index, the average price of single-family dwellings sold in Metro Detroit was $135,760 in September of 2020; this was $164 higher than the average family dwelling price in August. The September 2020 price was an increase of $8,290 from September of 2019.
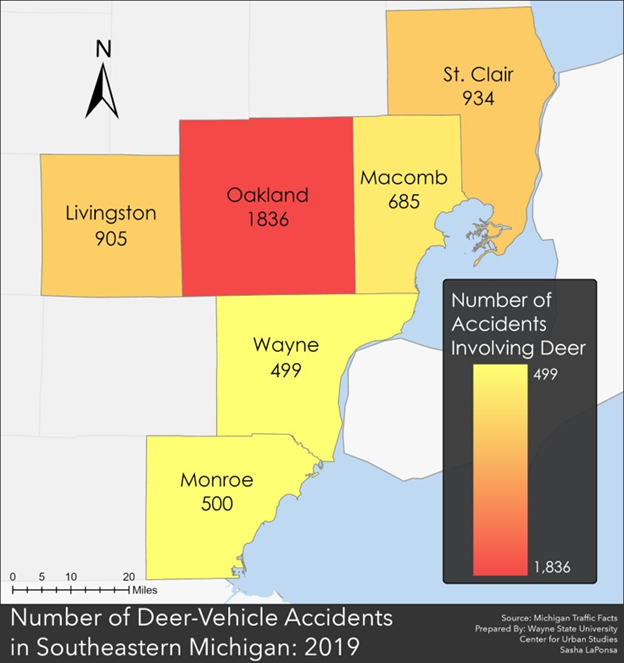
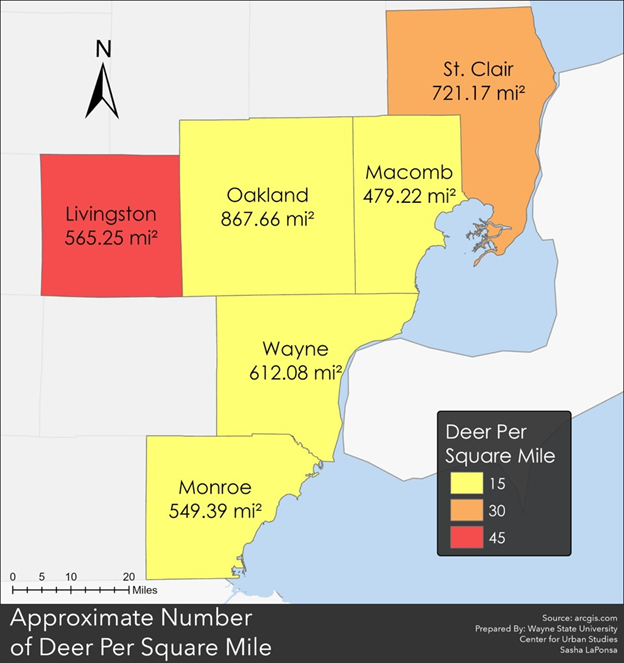
There are about 2 million deer in the State of Michigan and they are most active in the spring and fall at dusk and dawn. Such activity, especially in areas more heavily populated by deer and vehicles, can be attributed to thousands of deer-vehicle crashes a year. According to Michigan Traffic Facts, in Southeastern Michigan in 2019 Oakland County had the highest number of deer-vehicle crashes at 1,836. It is estimated by data3 from ArcGIS that Oakland County has a deer population of about 13,000, or 15 deer per square mile. Regionally, Livingston County has the highest deer population at about 25,400, or 45 deer per square mile. According to the data, there were 905 deer-vehicle crashes in Livingston County in 2019. Wayne County reported the fewest number of crashes in 2019 at 499; Wayne County’s deer population is estimated to be about 9,200 per square mile.
Washtenaw County data is forth coming.
While the size of a deer population plays a role in the number of deer-vehicle crashes in a county, so does the amount of traffic and how their living environment has been impacted. The Average Annual Daily Traffic map from the Southeastern Michigan Council of Governments shows that Livingston County has far less daily traffic than Oakland County. So, while Livingston County may have a higher deer population than Oakland County, the amount of traffic clearly plays a role. Also, according to the Michigan State Police, 80 percent of deer-vehicle crashes occur on two-lane roads.
As areas further develop, deer and humans are also interacting more, particularly as deer become more comfortable with their new neighbors. Backyard gardens, bird feeders and other items the deer prefer to munch on also bring them more in contact with humans, and the areas they live in—including their roadways–as they look for easily accessible areas to eat.
Deer-vehicle crashes may not be entirely avoidable but there are solutions to at least curb them. Such ways to avoid crashes with a deer include:
Watching the sides of the road as you drive, particularly in low visibility or tall grasses and woods near the road;
Being aware for groups of deer. If one deer crosses the road there is a good chance more may cross as they tend to travel in groups;
Using high beams at night (when possible) to help see farther ahead and to identify the eye-shine of a deer;
Avoiding swerving around a deer, instead break firmly and honk the horn;
Slowing down.
Government entities can also help curb the amount of deer-vehicle crashes by:
Enforcing speed limits;
Installing fences 8 feet or higher in high deer traffic areas to keep them off the road;
Studies to identify frequently used pathways of deer and setting up warning signs for drivers.
Installing specific devices that warn deer of oncoming traffic to scare them away from the road.
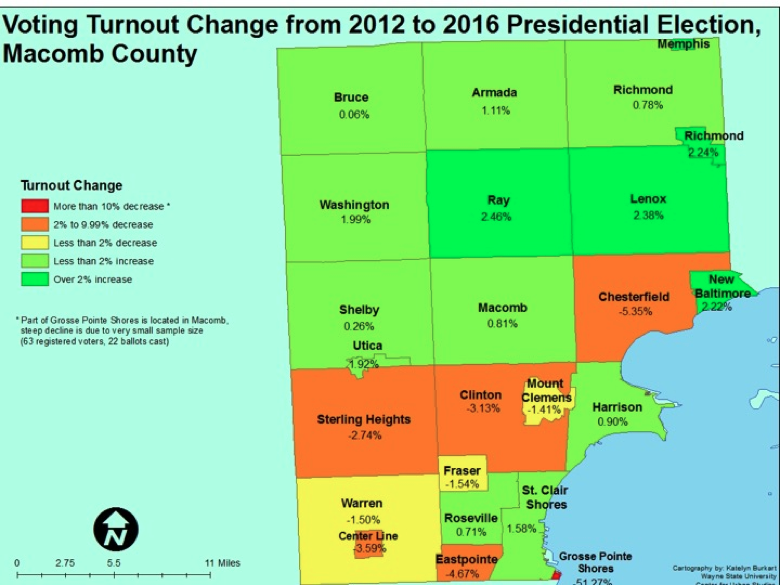
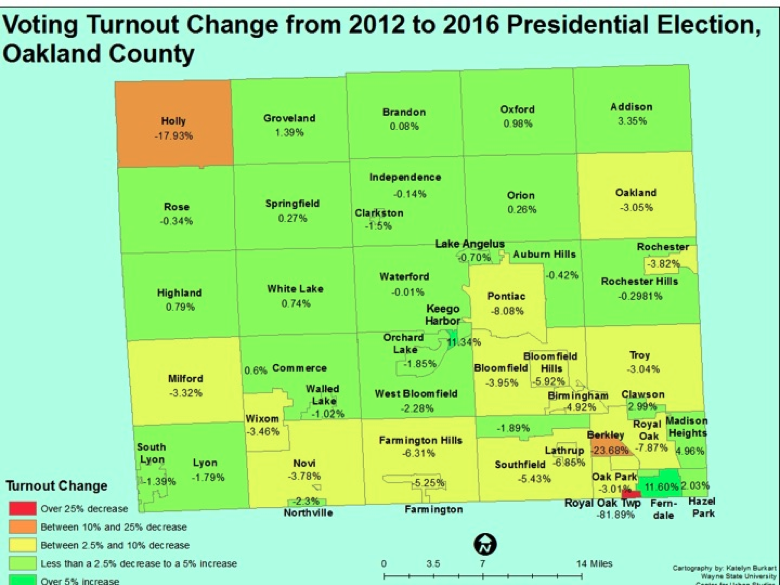
While record breaking turnout is expected for tomorrow’s election, we won’t know the results for a few days still. However, past data and current polls can help put this into context. So, we are re-examining the voter turnout change between the 2012 and 2016 Presidential Elections.
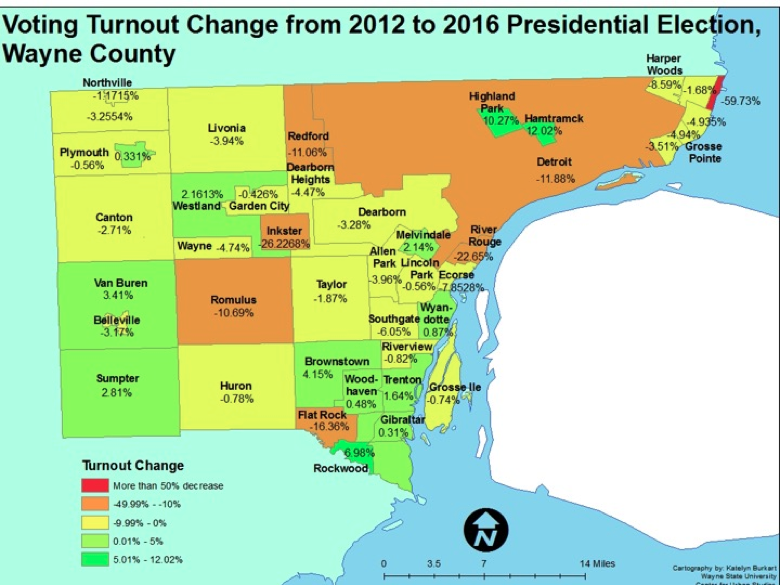
In 2016 Republican areas in Southeastern Michigan experienced marginally increased turnout between the 2012 and 2016 Presidential elections. The focus of that increase was southern Macomb County and the Downriver area in Wayne County. Conversely, the traditionally Democratic areas in Wayne County experienced some of the largest voter turnout decreases. Detroit saw especially large decreases.
In Macomb County, 15 communities experienced voter turnout increase, with increases ranging between 2.5 and 0.06 percent. Ray Township experienced the largest voter increase at 2.5 percent. Another interesting community that experienced voter turnout increase was St. Clair Shores; this city that flipped from Democratic to Republican, and here voter turnout increased by 1.6 percent. There were also eight of the communities that experienced a voter turnout decrease between the 2012 and 2016 Presidential elections. It was Chesterfield Township that experienced the largest decrease in the county at 5.35 percent. Although Warren and Sterling Heights have been noted for having several precincts flip from Democratic to Republican between the two Presidential elections, both cities had areas that remained Democratic in 2016. Sterling Heights experienced a 2.7 percent voter turnout decrease in 2016 and Warren experienced a 1.5 percent decrease.
We have previously highlighted how in Oakland County higher income communities like Bloomfield Hills and Birmingham flipped from being Republican in the 2012 presidential election to Democratic in the 2016 election. These communities though experienced a voter turnout decrease between the two elections, as did majority of the Oakland County communities that went Democratic in 2016. With the exceptions of Ferndale, Madison Heights and Clawson, all of the Democratic communities experienced a voter turnout decrease in 2016. Ferndale had the largest voter turnout increase in the county at 11.6 percent while Berkley had the largest decrease at 23.7 percent.
Wayne County communities experienced some of the largest decreases in voter turnout in 2016, with Inkster experiencing a 26 percent decrease, River Rouge experiencing a 23 percent decrease and Redford and Detroit experiencing 11 percent decreases, each. Again, these communities all went Democratic in the 2016 election; they also went Democratic in the 2012 election.
Throughout much of Downriver, an area that flipped from Democratic to Republican in 2016, an increase in voter turnout occurred. Rockwood had the largest increase at 7 percent. The city of Flat Rock did flip from Democratic to Republican between the two elections, but experienced a 16.36 percent voter turnout decrease.
Hamtramck and Highland Park experienced the largest voter turnout increases in Wayne County; Hamtramck had a 12 percent increase and Highland Park had an 11 percent increase. Both cities went Democratic in the 2012 and 2016 elections.
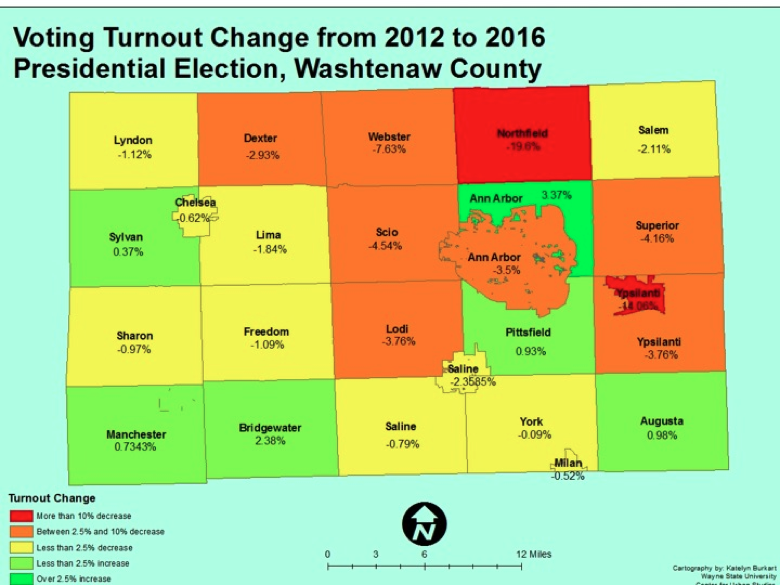
In Washtenaw County, Ann Arbor Township had the highest voter turnout increase at 3.37 percent; this community went Democratic in both elections. The only Washtenaw County community that went Democratic in the 2016 election and experienced a voter turnout increase was Sylvan Township; it had a 0.37 percent increase. There were, however, several Republican communities in Washtenaw County that experienced voter turnout increases. For example, Northfield Township experienced a 19.6 percent voter turnout increase.
Overall, the data comparing the 2012 and 2016 Presidential elections show there were very few communities in Southeastern Michigan that experienced large voter turnout increases (above 10 percent). The marginal increases though occurred in areas that went Republican in the 2016 Presidential election, particularly in northern Macomb County, St. Clair County and the Downriver area in Wayne County. Voter turnout for this election will certainly impact the results.
According to the Michigan Secretary of State there are more than 8 million registered voters in the State of Michigan as of Nov. 1, 2020. Additionally, 6.76 million of those are considered active voters, according to the Michigan Secretary of State. Election officials are expecting the Nov. 3, 2020 Presidential Election to be record breaking in terms of the number of ballots cast, and as of late last week Michigan Secretary of State Jocelyn Benson said more than 2.6 million Michigan residents had already cast a ballot, while about 3.3 million absentee ballots have been requested. Have questions about voter registration, your ballot or your polling location? Click here.
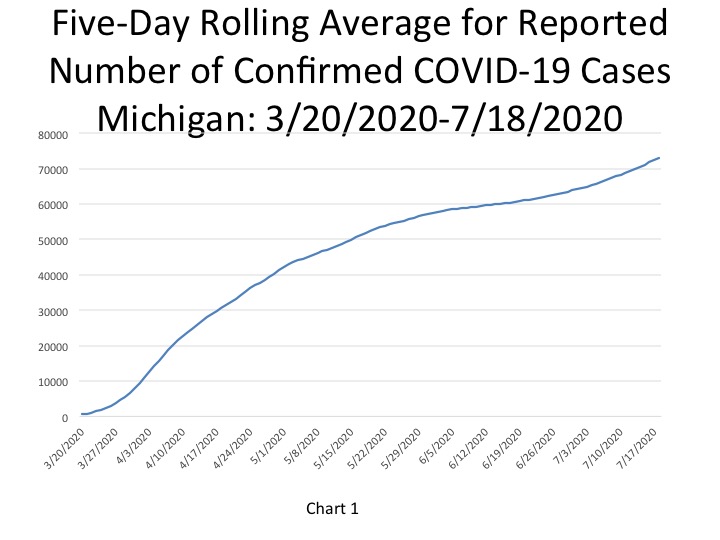
Michigan reported 1,586 new COVID cases on Oct. 20, 2020, bringing the total number of cases reported to 149,392. In Chart 1 we show that the State total for the number of COVID cases on Oct. 18 was 145,751–a five-day rolling average. The five-day rolling average for the total number of COVID cases (Chart 1) reflects a smoother curve and adjusts for fluctuations in testing and/or the quality of reporting or failure to report.
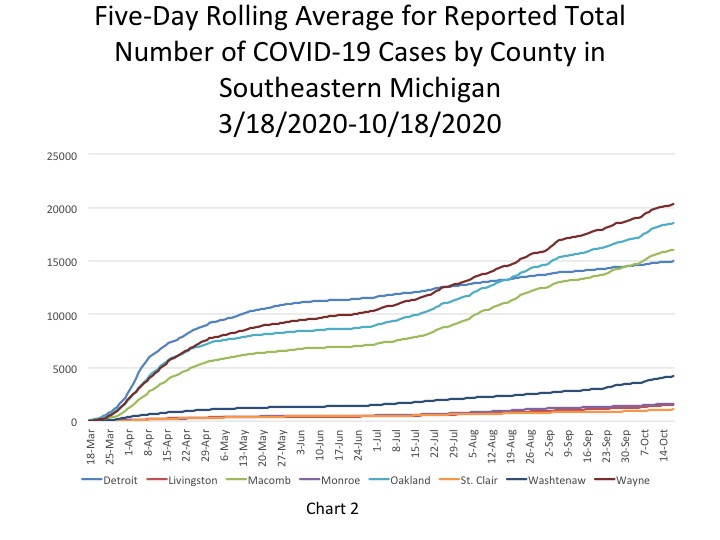
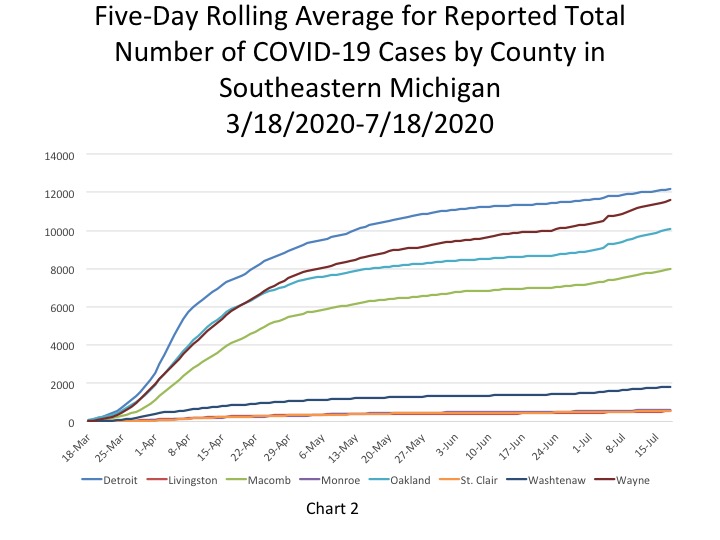
Chart 2 shows that, based on the five-day rolling averages, the growth of new COVID cases in Wayne, Oakland and Macomb counties continues to increase at higher rates than the other counties in the region and than Detroit. On Oct. 18, Wayne County reported the highest number of cases in the region at 20,322. Oakland County reported 18,589 cases and Macomb County reported 16,065. Detroit reported 14,969 COVID cases on Oct. 18; Macomb County surpassed the total number of confirmed cases in Detroit on Oct. 6. While the more densely populated areas in the region have the highest number of confirmed cases, Washtenaw County has pulled away from the other more rural counties in with higher numbers as well. Washtenaw County reported 4,190 confirmed cases on Oct. 18.
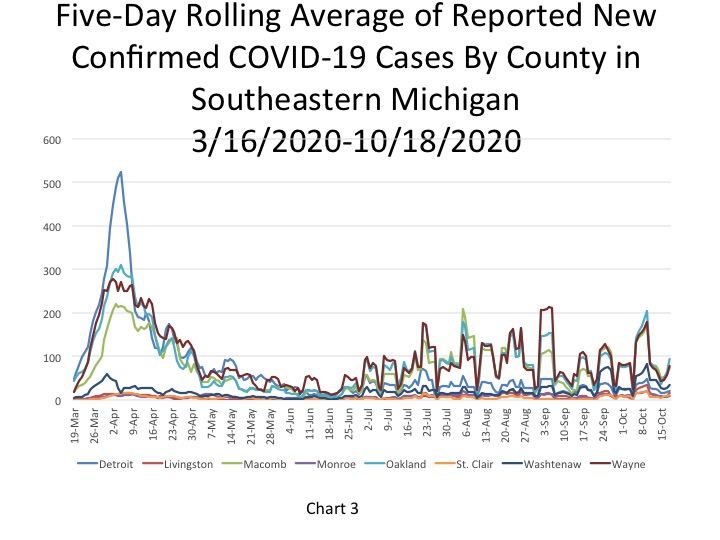
As shown in Chart 3, Oakland County reported the highest number of new daily confirmed cases on Oct. 18 at 94, followed by Wayne County with 78 new confirmed cases and Macomb County with 73. Washtenaw County reported 35 new daily confirmed COVID cases on Oct. 18 while Detroit reported 21. These numbers are also based on a five-day rolling average.
The daily data highlighted in these posts is from Michigan.gov/coronavirus, where data is updated daily at 3 p.m. Historical data were supplied from covidtracking.com, which republishes COVID data from the State. Additionally, the case totals do not reflect the number of people who have recovered, just those who have been infected. In early June the State changed how it reports its data on the website, making data more accurate in the long-term but more complicated to track as well. The State regularly updates older data and as we continue to publish regular updates on COVID the State’s changes to past data many not always be reflected in our posts. The data published in new posts is accurate for the day we received it on though.
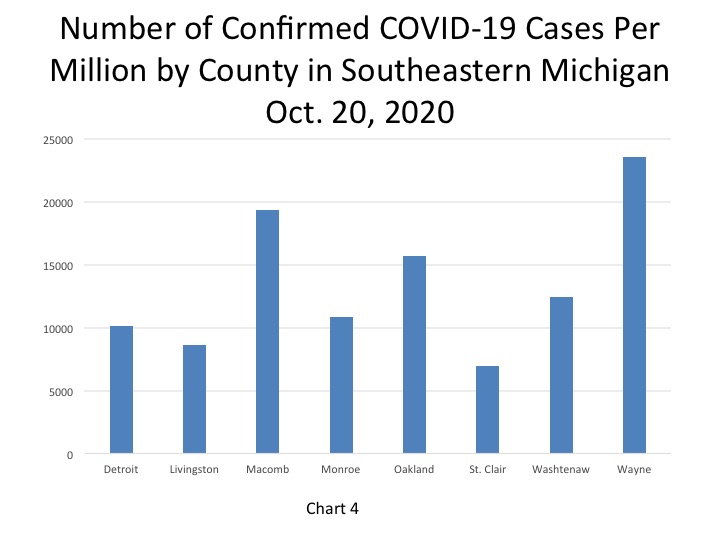
The chart below (Chart 4) highlights how Wayne County not only has the highest number of confirmed total COVID cases in the region (this data does not include Detroit’s numbers) it also has the highest number of confirmed cases per capita. According to the data released on Oct. 20, Wayne County had 23,598 COVID cases per million people. Macomb County had the second highest number of confirmed cases per million people at 19,351. Detroit had 10,019 confirmed COVID cases per million people; the only two counties in the region with few number of cases per capita were Livingston and St. Clair counties.
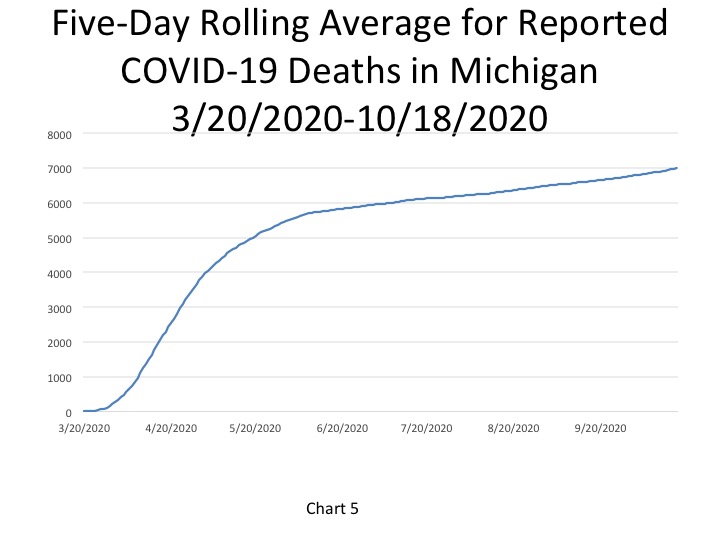
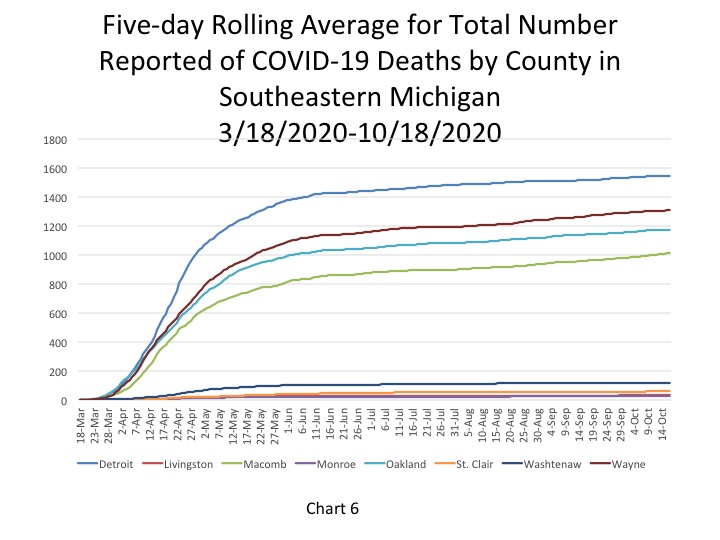
In Chart 5, the five-day rolling average for the number of deaths, shows the number of deaths in the State of Michigan reached 6,996 on Oct. 18. The actual cumulative COVID-19 deaths on Oct. 20 was 7,053, an increase of 22 deaths from the prior day, with one of those deaths being added to the total through death record reviews. Chart 6 (a five-day rolling average) shows that on Oct. 18, the City of Detroit reported 1,546 deaths. Wayne County had the second highest total at 1,309 deaths on Oct. 18. Although the curved has flattened for the number of COVID deaths in Southeastern Michigan, the numbers are still growing, just at a much slower pace.
COVID-19 numbers in Michigan continue to increase at a quicker rate than what has occurred in months. Classrooms and gatherings some of the main areas where outbreaks are occurring. According to the State of Michigan, as of Oct. 15, there were outbreaks in 84 Michigan school buildings in 31 counties. Overall, between Oct. 8 and Oct. 15 there was a 25 percent increase in K-12 classroom outbreaks. Furthermore, universities are also seeing increases in the student population contracting COVID. To slow the spread within this community some universities and local health departments are taking their own precautions. For example, the Washtenaw County Health Department just issued a 2-week stay at home order for University of Michigan undergraduate students to curb the spread. In Washtenaw County last week the number of new confirmed and probable COVID cases increased by more than 600.
As the daily number of confirmed COVID cases continue to increase by more than 1,000 daily we must continue practice the mandates set forth by the Michigan Department of Health and Human Services, which includes wearing masks, remaining socially distant and limiting social gatherings.
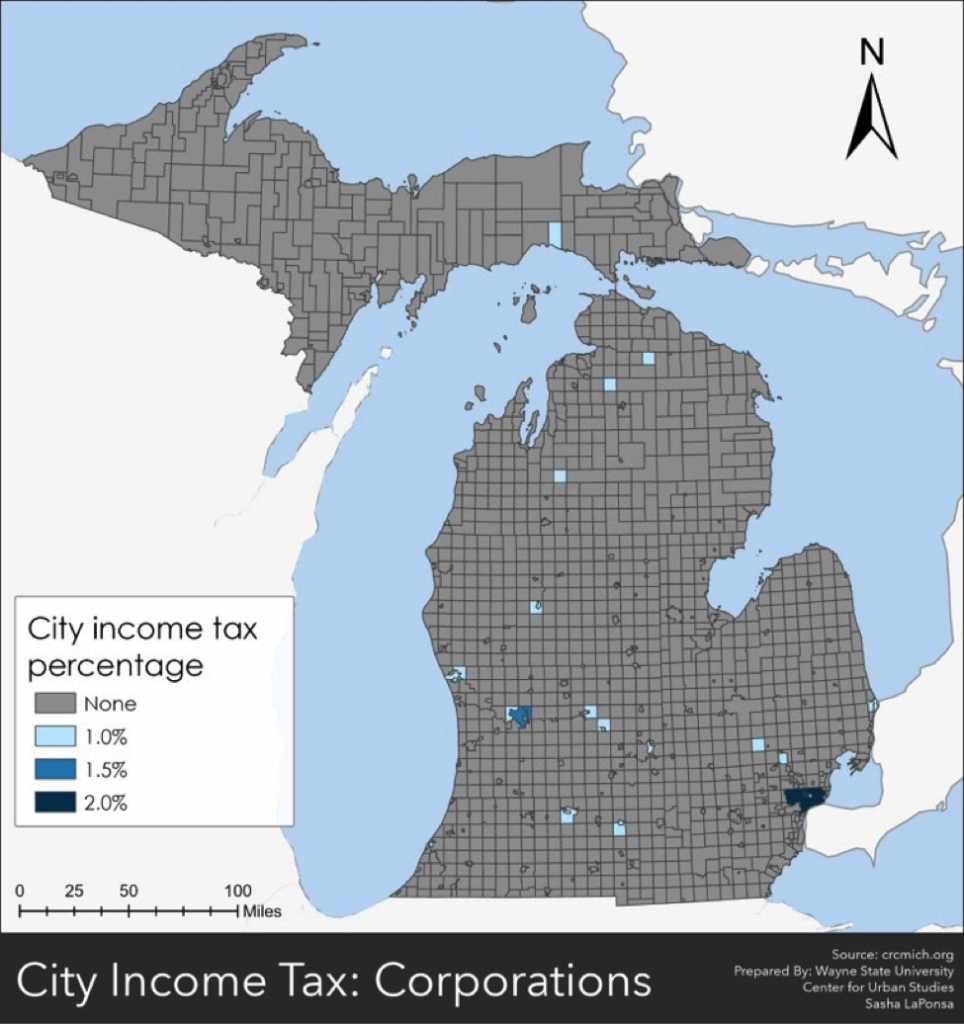
In the State of Michigan local governments have the ability to levy a local income tax on those who live and/or work in the municipality. There are 24 municipalities in Michigan that levy a local income tax for residents, non-residents and corporations. According to the Citizens Research Council of Michigan, the cities of Detroit and Hamtramck were the first two municipalities in the state to levy local income taxes in 1962. As of 2018 Detroit levied at 2.4 percent income tax on residents and a 1.2 percent income tax on non-residents. In Hamtramck, a 1 percent income tax was levied on residents and a 0.5 percent income tax was levied on non-residents. According to Michigan tax law, and as is shown, non-residents cannot be taxed more than 50 percent of the local income taxed on residents.
According to Michigan tax law, in general, a 1 percent income tax can be charged on residents and corporations and a 0.5 percent income tax can be changed to non-residents earned in the imposing city. The city council in cities over 600,000 (Detroit) may impose rates of up to 2.4 percent on residents, 2 percent on corporations and 1.2 on non-residents. Furthermore, a city that levied an income tax and where more than 22 mills had been levied for city purposes and at least 65 mills for all purposes during the prior calendar year is allowed to impose local income tax rates of up to 2 percent on residents and corporations and 1 percent on non-residents if approved by voters before Nov. 15, 1988. Additionally, cities that levied an income tax before March 30, 1989, and with (a) populations between 140,000 and 600,000 (Grand Rapids); or (b) populations between 65,000 and 100,000 in a county with a population below 300,000 (Saginaw) may increase the tax rate to not more than 1.5 percent on residents and corporations and 0.75 percent on nonresidents if approved by voters.
According to the State of Michigan, Detroit has the highest income tax at 2.4 percent, followed by the City of Highland Park at 2 percent (both of which are imposed on residents). A 2 percent local income tax was imposed on corporations in Detroit and Highland Park as recent as 2018, according to the Citizens Research Council.
In 2017 (most recent data available) Detroit levied about $292.7 million through its local income tax on residents, non-residents and corporations; Hamtramck levied $2.3 million Grand Rapids and Sagniaw each levied 1.5 percent income taxes on residents and corporations. Grand Rapids levied the second highest amount in local income taxes at about $94 million. Of course, the amount each city levies is not only dependent on the amount levied by the three groups but also by the population of who lives there, who works there and what businesses are there.
In addition to the cities above the, the following cities issue income taxes of 1 percent on residents and corporations:
Albion
Battle Creek
Benton Harbor
Big Rapids
East Lansing
Flint
Grayling
Hamtramck
Hudson
Ionia
Jackson
Lansing
Lapeer
Muskegon
Muskegon Heights
Pontiac
Port Huron
Portland
Springfield
Walker
The city that earned the lowest amount in a local income tax is Hudson at about $484,000.
In addition to the cities discussed above, the City of Mount Clemens has also discussed levying a local income tax to earn more local revenue. Mount Clemens is the county seat in Macomb County, which employs about 2,000 county employees. Local income taxes are a means for a local government to generate additional revenue. And, while it helps the local governments–especially ones who lack additional means to levy revenue–it also impacts those who live in the municipality and those who work and/or own a business there.
On July 20, the State of Michigan reported a total of 74,152 cases, an increase of 489 cases from the day prior. In terms of the number of new daily cases, the 489 new COVID cases reported on July 20 is a small increase from the 483 new cases reported on July 19. Of the new 489 new COVID cases, 202 were documented in Southeastern Michigan. In total, 41 percent of the new COVID cases were in Southeastern Michigan, meaning case numbers are increasing at a higher rate outside of the region than locally. In Chart 1 we show that the State total for the number of COVID cases on July 18 was 73,068–a five-day rolling average. The five-day rolling average for the total number of COVID cases (Chart 1) reflects a smoother curve and adjusts for fluctuations in testing and/or the quality of reporting or failure to report.
Chart 2 shows that, based on the five-day rolling averages, the growth of new COVID cases in Southeastern Michigan continues to increase, with the numbers in Wayne County continuing to inch closer to those being reported in Detroit. On July 18, Wayne County’s numbers reached 11,595. Detroit, which continues to have the highest overall number of cases, reported 12,178 COVID cases as of July 18. Oakland County reported 10,110 cases and Macomb County reported 8,013.
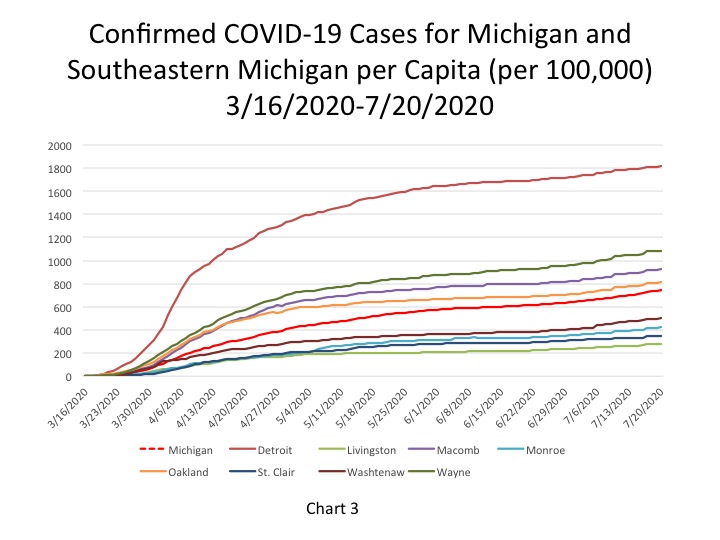
The City of Detroit had 1,817 COVID cases per 100,000 people as of July 20, an increase from 1,812 on July 19 (Chart 3). This is based upon a reported increase of 32 new COVID cases between July 19 and July 20, bringing the total number of COVID cases in Detroit to 12,223. Wayne County reported 11,085 cases per 100,000 people, and Oakland County had 810 cases per 100,000 people. These per capita rates were based upon 11,686 total cases for Wayne and for 10,191 Oakland. Macomb County reported 928 cases per 100,000 people, which is based upon 8,107 cases.
The daily data highlighted in these posts is from Michigan.gov/coronavirus, where data is updated daily at 3 p.m. Historical data were supplied from covidtracking.com, which republishes COVID data from the State. Additionally, the case totals do not reflect the number of people who have recovered, just those who have been infected. In early June the State changed how it reports its data on the website, making data more accurate in the long-term but more complicated to track as well. The State regularly updates older data and as we continue to publish regular updates on COVID the State’s changes to past data many not always be reflected in our posts. The data published in new posts is accurate for the day we received it on though.
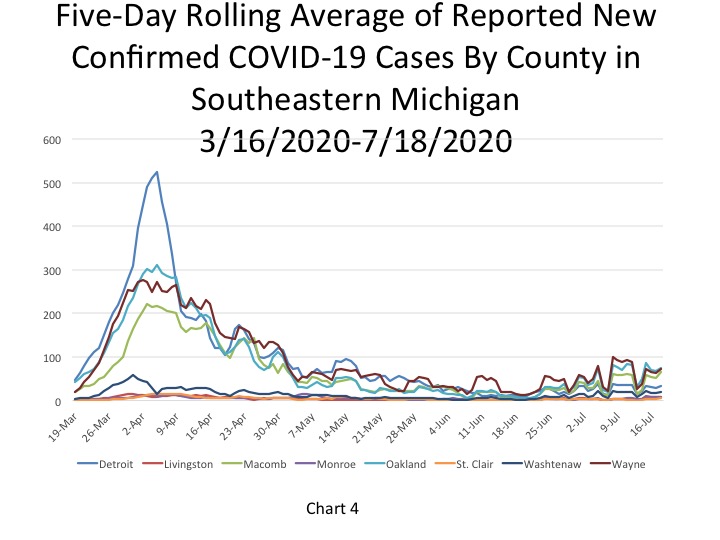
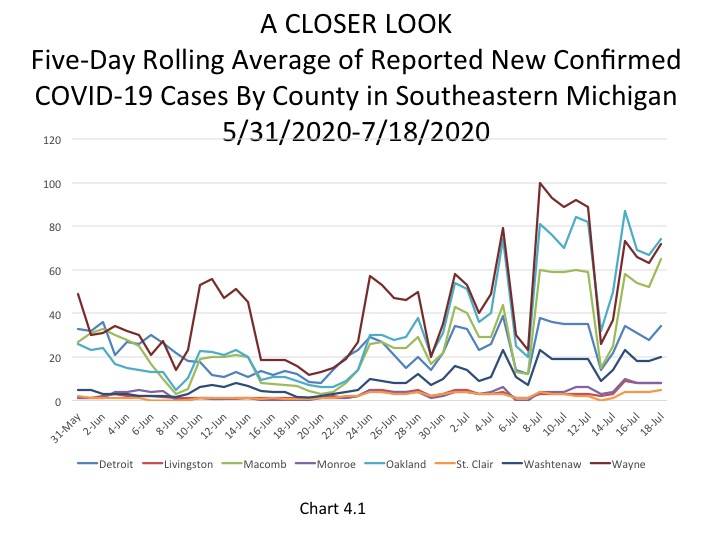
Chart 4 shows that Oakland County has been reporting the highest number of daily cases, according to the five-day rolling average, in about the last week. On July 18, Oakland County reported 74 new daily cases; Chart 4.1 also shows this, but at a more zoomed in level. The charts also show that Detroit reported 34 new cases on July 18, which is lower than the new cases reported out of Macomb and Wayne counties as well. Macomb County reported 62 new cases and Wayne County reported 72.
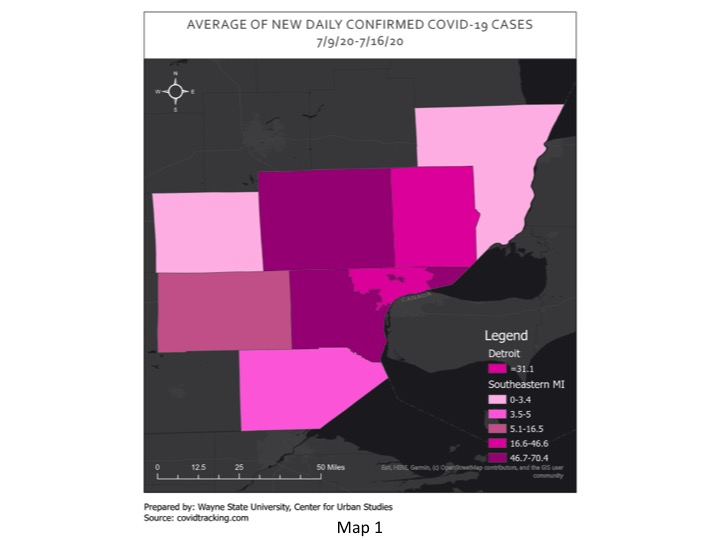
Map 1, which shows the average number of new daily COVID cases between July 9 and July 16 for Southeastern Michigan, highlights how Wayne County had the highest average number of new cases at 70.4, but Oakland County was right behind it with an average of 68.8. new cases. The map also shows that for Detroit the average number of new cases last week was 31.1 and it was 46.6 for Macomb County. As the data above shows, all four of those entities, and the remaining counties in the region all reported lower average weekly numbers for new daily COVID cases between July 9-16 than what was reported on July 18.
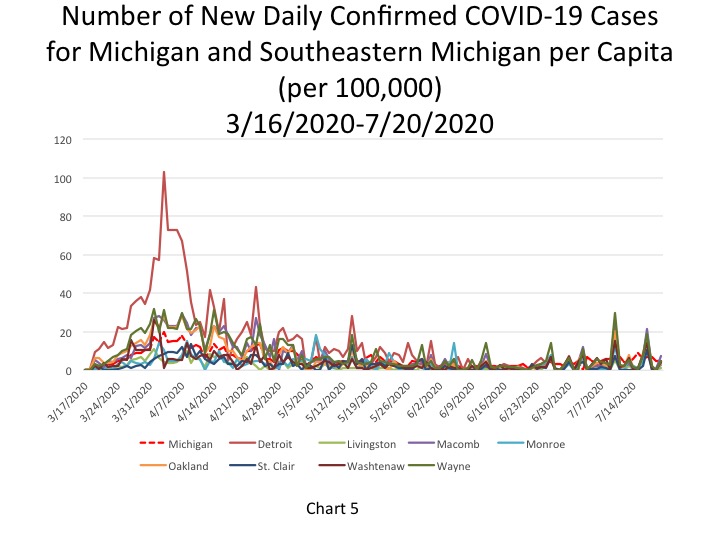
On July 20, the per capita rate for the number of new daily COVID cases per 100,000 people was 5 for the State, which was equivalent to 482 new cases (Chart 5). Detroit and Wayne County also each reported a per capita rate of 5 new daily COVID cases per 100,000 people on July 20, which was equivalent to 32 and 50 new cases, respectively. Macomb County was the only entity in the region to report a higher per capita rate than the State. Macomb County reported a per capita rate of 7 which was equivalent to 65 new daily cases. Oakland County reported a per capita rate of which was equivalent to 42 new cases. In Southeastern Michigan there were 202 new COVID cases reported on July 20.
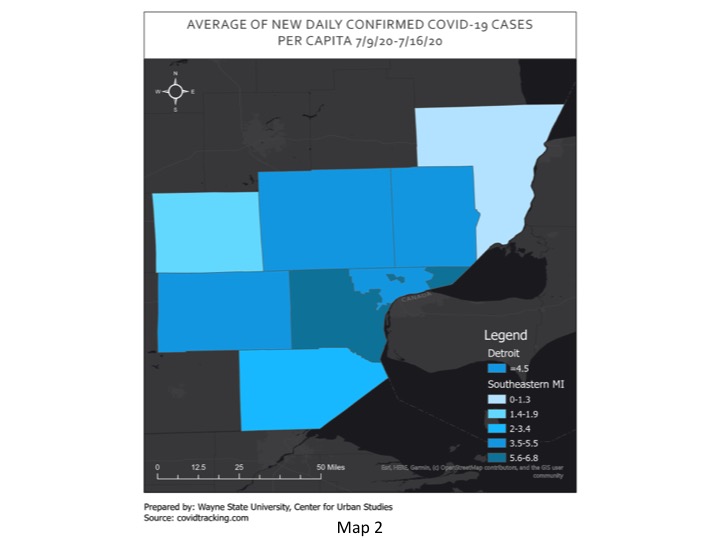
Map 2 mimics the message of Map 1, with Wayne County having the highest average number of daily confirmed COVID cases per 100,000 between July 9 and July 16. During that week Wayne County had an average of 6.8 daily COVID cases per 100,000 people. Detroit averaged a per capita rate of 4.5 during that time frame.
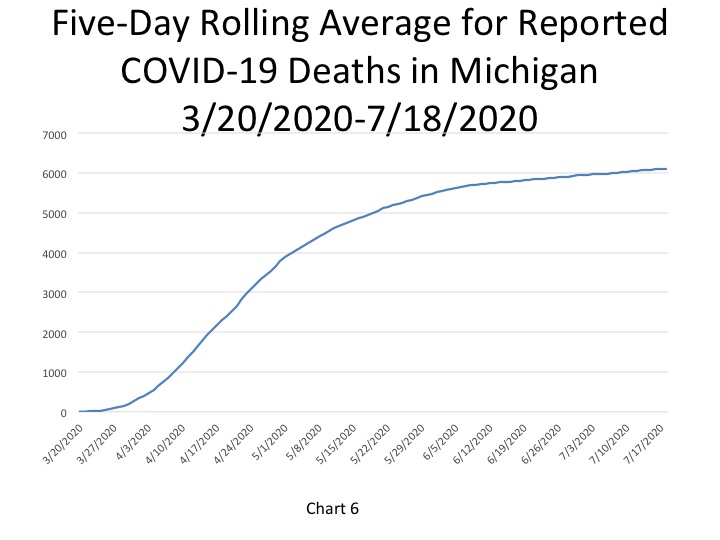
In Chart 6, the five-day rolling average for the number of deaths in Michigan, shows the number of deaths in the State of Michigan reached 6,114 on July 18. The actual cumulative COVID-19 deaths on July 20 was 6,126, an increase of 7 deaths from the prior day. Of the 7 deaths that were reported on July 20, 4 occurred in Southeastern Michigan.
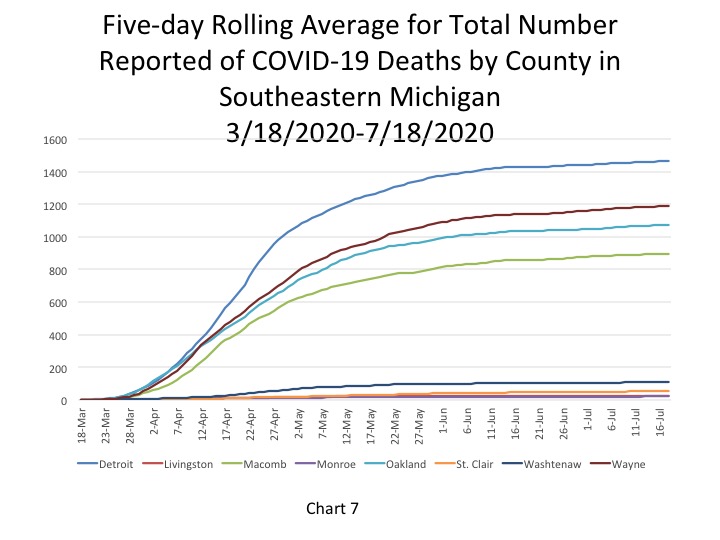
Chart 7 (a 5-day rolling average) further hones in on where the majority of the COVID deaths in Michigan have occurred, and continue to occur, in Southeastern Michigan. As of July 18, the City of Detroit had reported 1,467 deaths. Wayne County had the second highest total at 1,190 deaths on July 18.
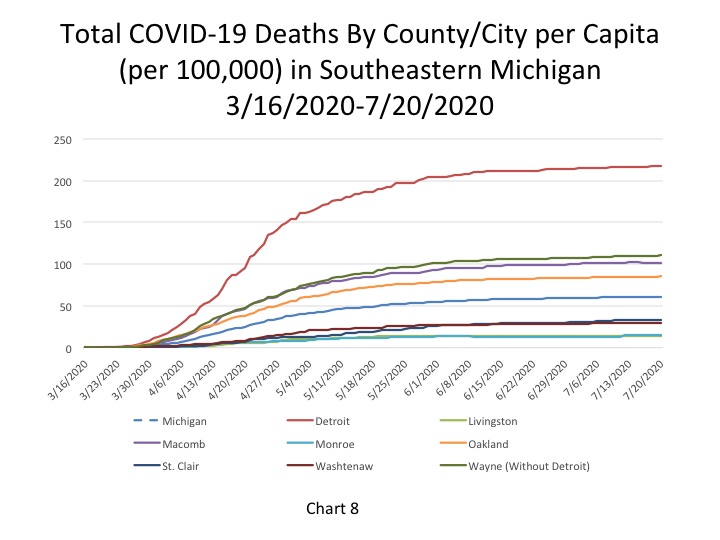
The per capita rates for the number of total COVID deaths in Southeastern Michigan continues to remain fairly stagnant across the region. Detroit reported 218 total COVID deaths per 100,000 people on July 20, which was equivalent to 1,468 deaths. Wayne County reported a per capita rate of 111 (1,191 deaths), Macomb County reported a per capita rate of 103 (892 deaths) and Oakland County reported a per capita rate of 86 (1,076 deaths). The State of Michigan reported a per capita rate for the number of total COVID deaths at 61 per 100,000 people, which was equivalent to 6,126 total deaths.
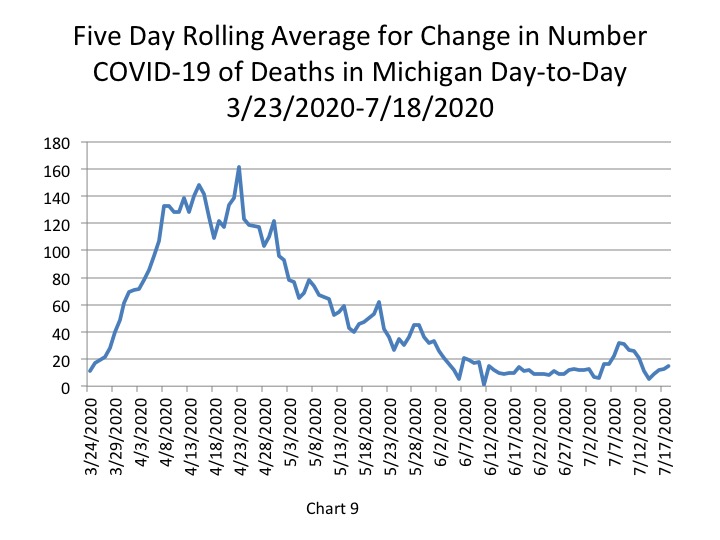
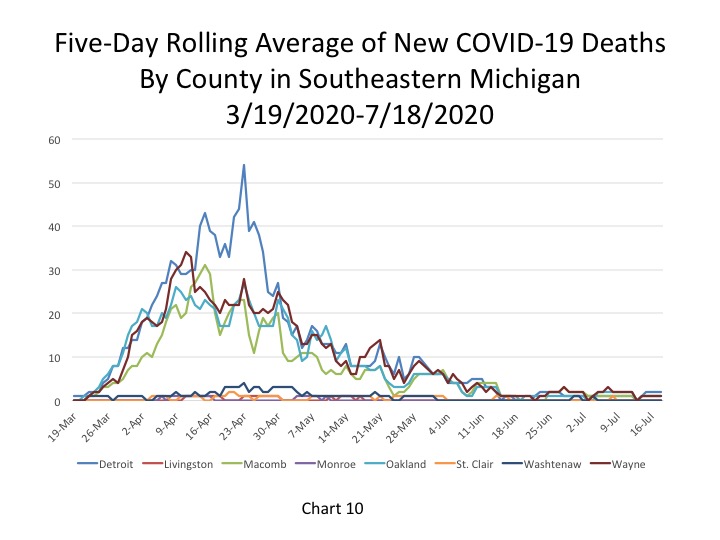
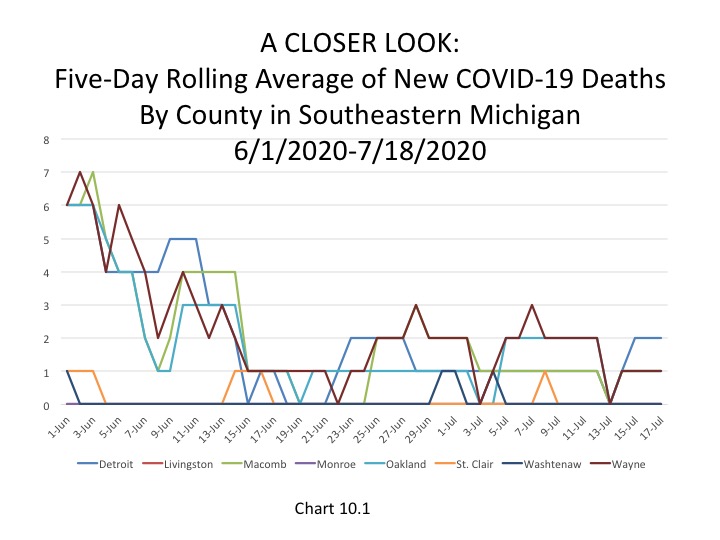
Chart 9, the five day rolling average of deaths, shows the number of new statewide deaths was reported at 15 on July 18. Furthermore, Chart 10 and Chart 10.1 shows how the number of deaths in Southeastern Michigan continues to remain low. Chart 10.1 shows a more in-depth look at the number of new daily COVID deaths in the last month so viewers can better discern where in the Southeastern Michigan the numbers are increasing, decreasing or remaining the same. Detroit reported 2 new daily deaths on July 18 while Macomb, Oakland and Wayne each reported 1.
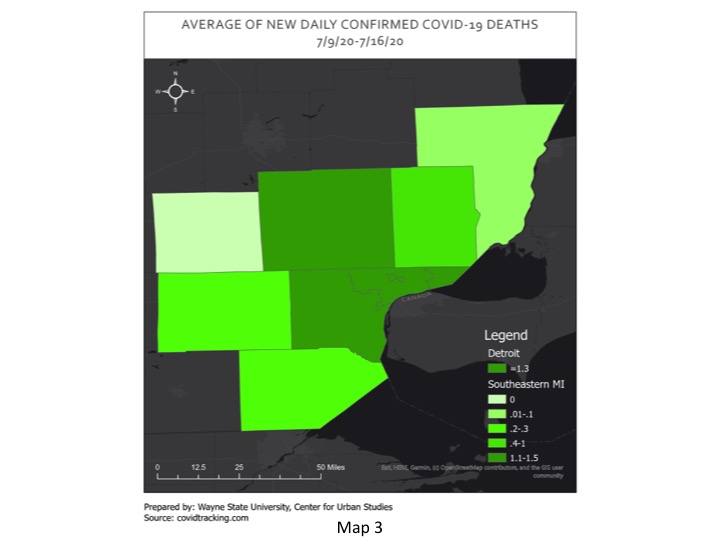
In Map 3, Wayne and Oakland counties had the highest average number of daily COVID deaths between July 9 and July 16 at 1.5 and Detroit averaged 1.3 deaths. Macomb County averaged 1 death during that time frame. The averages last week reported in the map are similar to the daily death numbers that have been being reported in Southeastern Michigan.
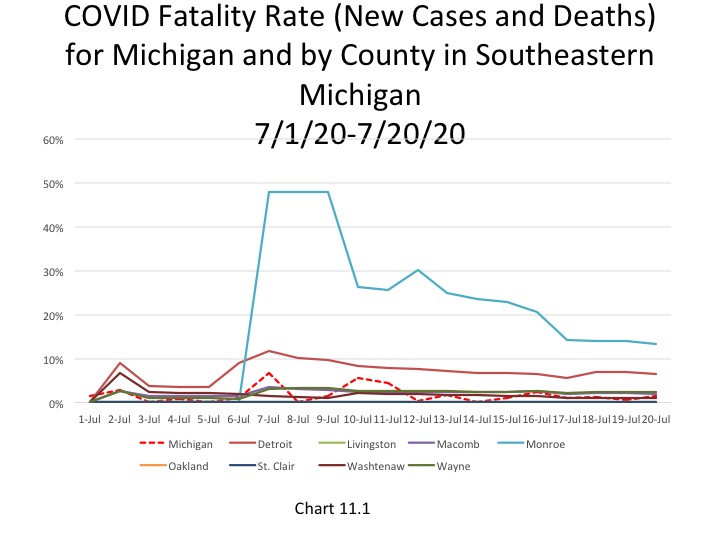
Chart 11.1 shows the fatality rate for just the month of July with the cumulative number of new cases and deaths for only this month. This chart was created in recognition that case and death numbers are lower than they were even a month ago and to highlight how even if case numbers spike death numbers continue to remain low. Using only July cumulative data for the new number of cases and deaths, Monroe County has recently had the highest fatality rate, which was reported at 13.4 percent on July 20, which is based on 13 new cumulative deaths since the beginning of July and 97 new cumulative cases. The overall fatality rate for most of the region is much higher than the new recent cumulative look we are exploring. For example, the City of Detroit had an overall fatality rate of 12 percent on July 20 but with a more recent look, which includes lower new daily case and death numbers, it was 6.45 percent (as shown in the chart below).
On July 20 the State of Michigan reported 489 new COVID cases, which is amongst the lowest daily total reported in about a week. With weekend numbers reaching close to 700, the decline is welcomed but also means we—as a State and a society—have a ways to go to get to a more manageable number of new daily case numbers.
The coronavirus pandemic has impacted the daily lives of everyone-from their work and school schedules to the way we obtain goods and services to how we recreate and interact with others. These changes directly relate to national and local mobility trends, especially since several Executive Orders in Michigan have either mandated or encouraged people to stay home and telecommute whenever possible.
The data we present here show the changes in mobility in Southeastern Michigan. These data were produced by Google, which is creating mobility reports for each State during this pandemic. The data presented below highlights the percent change in visits to places like grocery stores and parks in the seven counties that make up Southeastern Michigan. The list below is the percent change in mobility to these places between the first of April to mid-May for the State of Michigan. The maps below also reflect that timeframe and show the percent change in mobility trends at the county level for Southeastern Michigan compared to what baseline for mobility was to these places before the pandemic hit.
Shifts in Mobility Trends: Michigan
Residential: +8%
Workplaces: -28%
Grocery and pharmacy: -6%
Retail and recreation: -34%
Parks: +180%
Transit stations:-24%
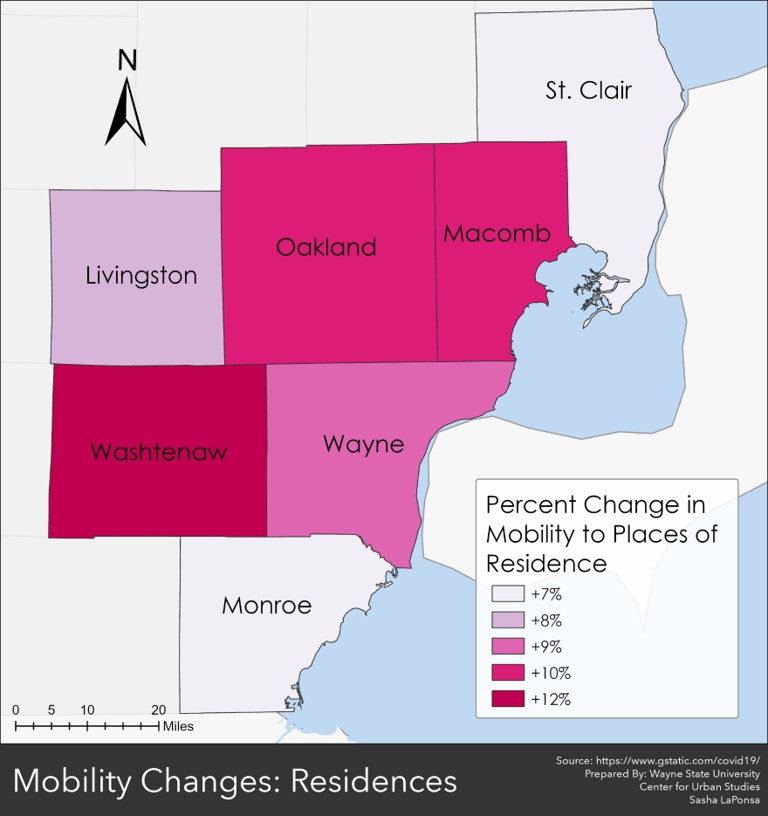
Places of Residence
With the coronavirus pandemic came a statewide lockdown, which mandated people only leave their homes for necessities and not to visit with anyone outside of their homes, unless they were an essential worker. However, even with the mandate there was an increase in mobility between residences, statewide and locally. Statewide, there was an 8 percent increase in mobility to residential homes, and in Southeastern Michigan there was between a 7-12 percent increase, depending on the county. Washtenaw County had the highest percent increase in mobility between residences at 12 percent; St. Clair County had the lowest percent change at 7 percent. In Wayne County there was a 9 percent increase in mobility between residences, and in Macomb and Oakland counties there was a 10 percent increase.
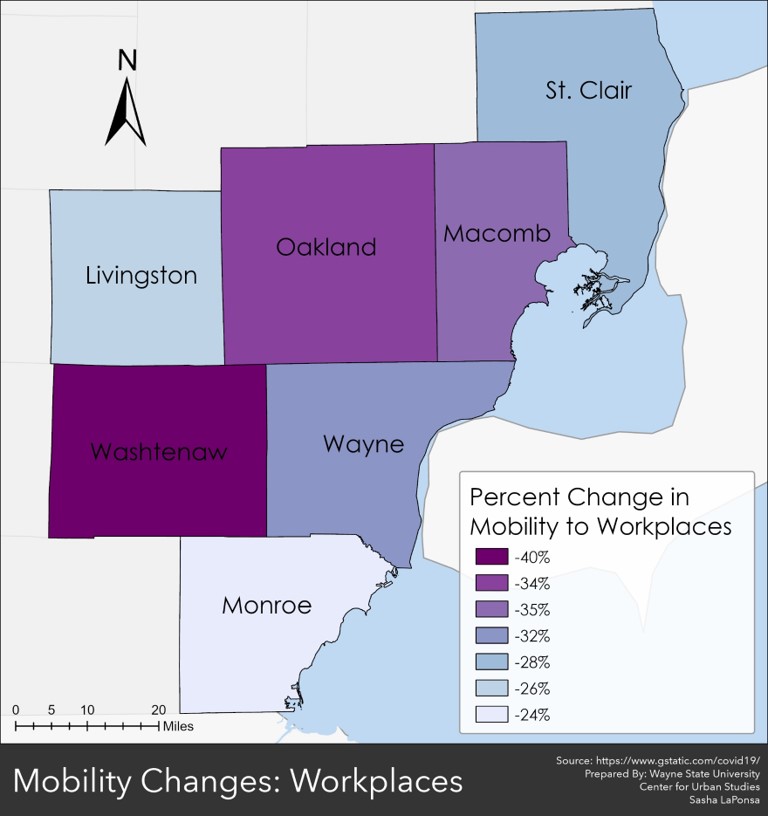
Workplaces
As noted, the Governor’s emergency orders throughout the pandemic have required certain places of business to close and for others to allow for telecommuting whenever possible. With such policy shifts came a decline in mobility to workplaces all throughout Michigan. At the State level there was a 28 percent decline from the normal amount of mobility to workplaces, and throughout Southeastern Michigan there was between a 24-40 percent decline in mobility to workplaces between the beginning of April and mid-May. Washtenaw County had the largest decline at 40 percent. In Wayne County there was a 32 percent decline in mobility to workplaces prior the coronavirus pandemic, in Oakland County there was a 36 percent decline, and in Macomb County there was a 35 percent decline. Monroe County had the smallest percent decline from the baseline at 24 percent.
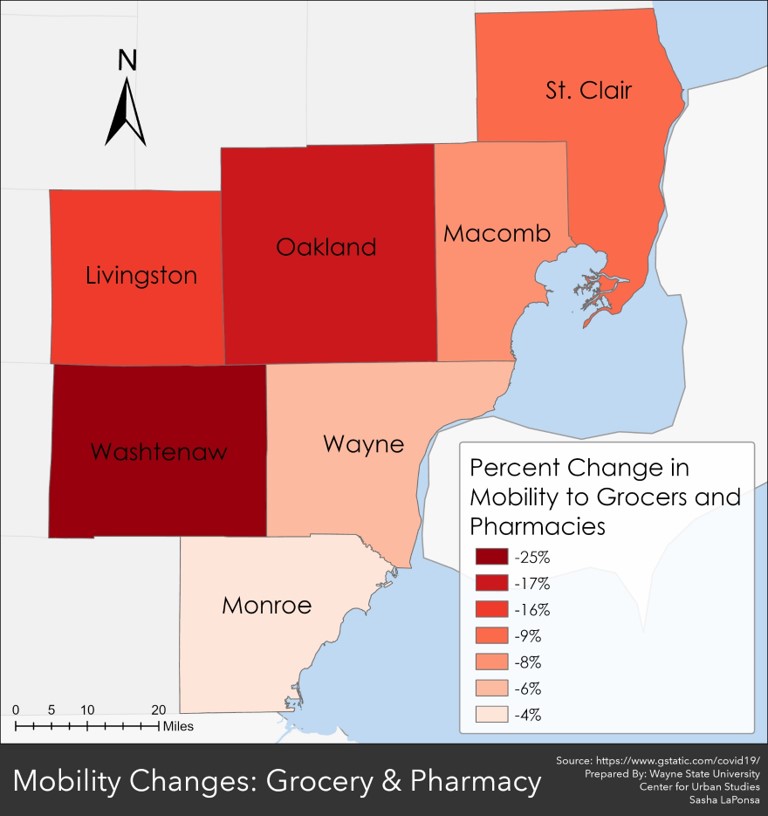
Grocery Stores and Pharmacies
Between April and mid-May there was a decrease in mobility to grocery stores and pharmacies throughout Michigan, including in Southeastern Michigan. Washtenaw County experienced the largest decline at 25 percent while Monroe County’s shift was only 4 percent lower than the amount residents normally commute to these places. Although we witnessed bare shelves at the beginning of the pandemic, with certain product shortages continuing through today, the decline in mobility to these stores is not surprising as both consumers and businesses shifted to online and third party delivery services.
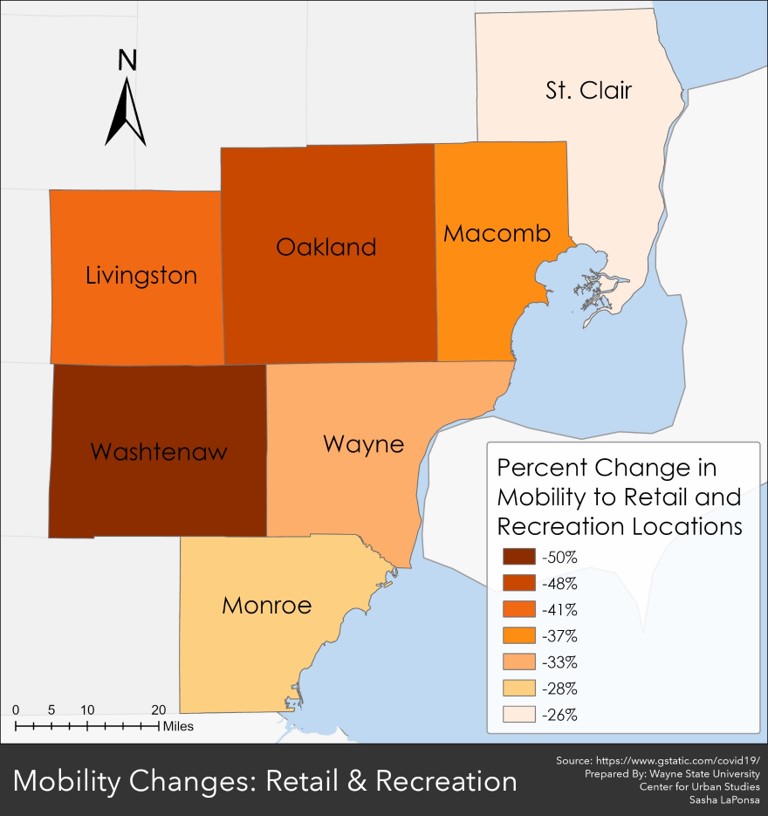
Retail and Recreation Locations
With the restrictions on business operations, including if they could even remain open to the public, it is also not surprising that at the State and local levels mobility trends have experienced a decline to retail and recreation locations. Washtenaw County again experienced the largest decline in mobility from the frequency residents were traveling before the pandemic to retail and recreation locations. According to the data, there was a 50 percent decline in commuting to retail and recreation locations for Washtenaw County. In Wayne County that decline was 33 percent, in Macomb County it was 37 percent, and in Oakland County it was 48 percent. At the State level there was a 34 percent decline from the baseline in the amount people traveled to retail and recreation locations.
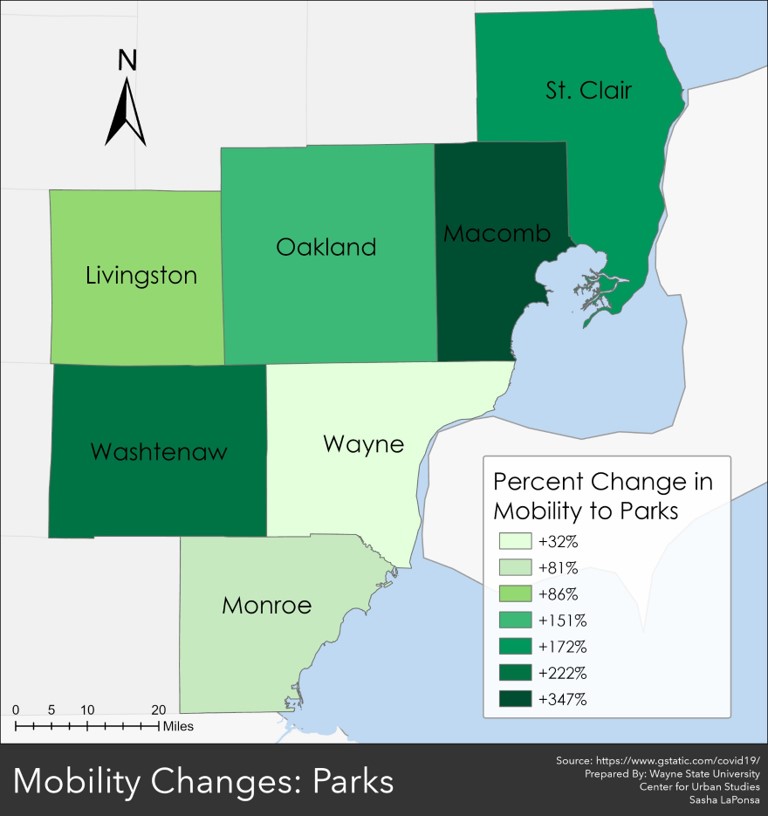
Parks
Similar to the trend being experienced at the State level, all counties in Southeastern Michigan have experienced an increase in mobility to parks. Wayne County experienced the smallest percent change at 32 percent while Macomb County experienced the largest percent change at 347 percent. There were three counties-Macomb, St. Clair and Washtenaw – where mobility to parks increased at a higher rate than the mobility rate increase at the State level (180 percent).
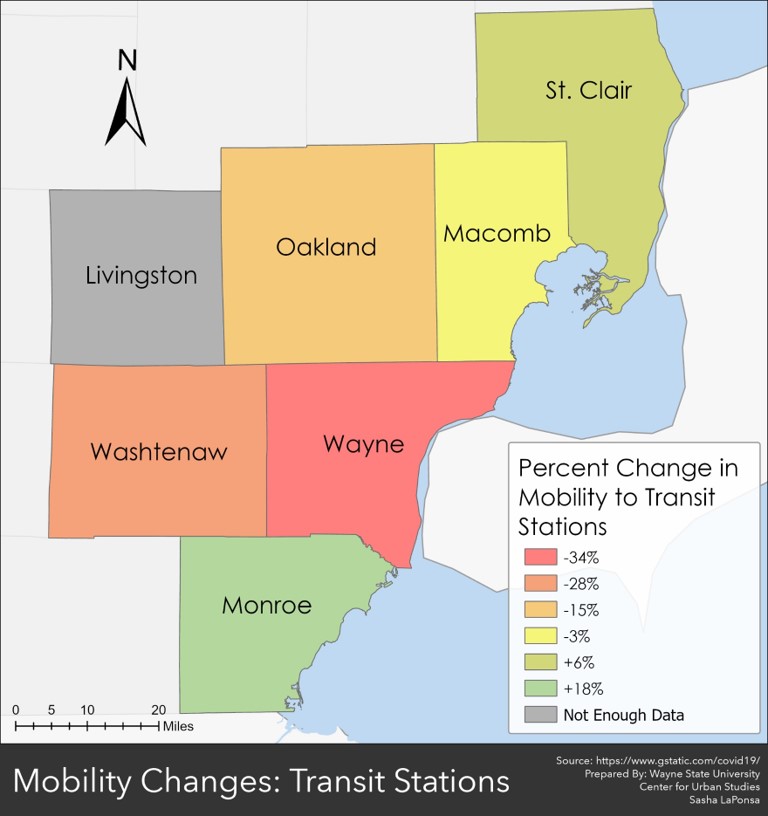
Transit Stations
The data also shows that there was a decrease in mobility to transit stations throughout most of Southeastern Michigan, but not the entire region. In Monroe and St. Clair counties there was an 18 and 6 percent increase in mobility, respectively. In Wayne County, which provides public transportation via both the Detroit Department of Transportation and the Southeastern Michigan Authority of Regional Transit (SMART) mobility to these stations decreased by 34 percent. There are also communities in Oakland County and all of Macomb County that offers public transportation via SMART; mobility to these stations declined by 15 percent and 3 percent, respectively. In Washtenaw County, where there is also a local transportation system, mobility to these stations declined by 28 percent. There was a 24 percent decline in mobility to transportation stations at the State level.
Overall, this data provides a glimpse into how the coronavirus pandemic has shifted certain aspects of our everyday ways of life. These current shifts could lead to long-term policy changes as we as a state and a nation are seeing that telecommuting, road diets and contactless shopping, among other changes, are possible. Pros and cons can be argued for the long-term impacts of such changes, however, decreases in commuting does mean a decline in certain pollutants being emitted, which is environmentally beneficial and a shift we need to implement for the long-term viability of this planet.