Metro-Detroit Transit Continues With Uphill Battle Despite SMART Millage Passage

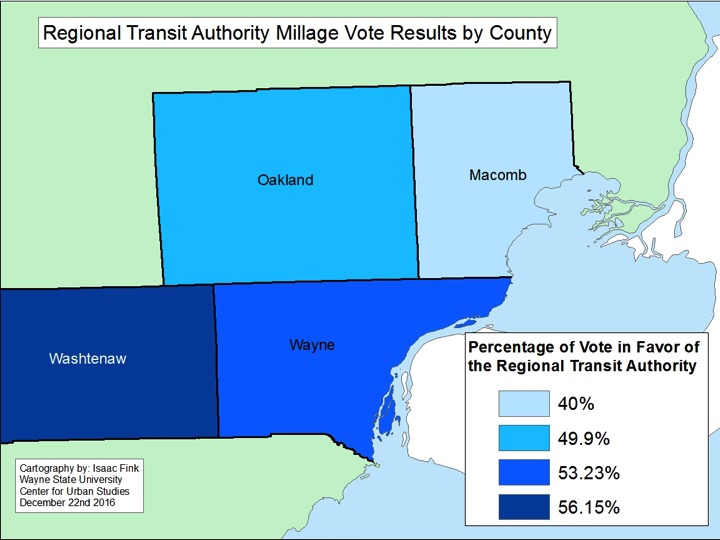
The Suburban Mobility Authority For Regional Transportation (SMART) received a vote of confidence from the tri-county region for its four-year 1 mill millage renewal, which was also a slight increase for communities in Macomb and Oakland counties (the increase request was due to Headlee amendment rollbacks in previous years that brought original 1 mill rate slightly below that). However, even though election results show the SMART millage passed in Macomb County and in areas of Oakland and Wayne counties on Aug. 7, 2018, there were questions if that was really the case. In mid-August the Michigan Taxpayers Alliance requested a partial recount of the Macomb County SMART millage vote because the millage proposal only passed by 39 votes. According to the election results, 77,500 Macomb County voters were in favor of the millage renewal and increase and 77,461 Macomb County voters cast a ballot against the proposal. With a 50 percent passage rate, the group felt a recount was needed to ensure the results were accurate. On Aug. 29 the group stopped the partial recount because it became evident that there would not be enough “no” votes to overturn the originally approved millage approval, according to a Michigan Radio news article.

In Wayne County the SMART millage had a 73 percent passage rate, with 78,943 of the voters in favor of the millage renewal and slight increase. Oakland County had the highest pass rate at 77 percent, with 123,435 of the voters in favor of the proposal and 36,723 of the voters voting against it.

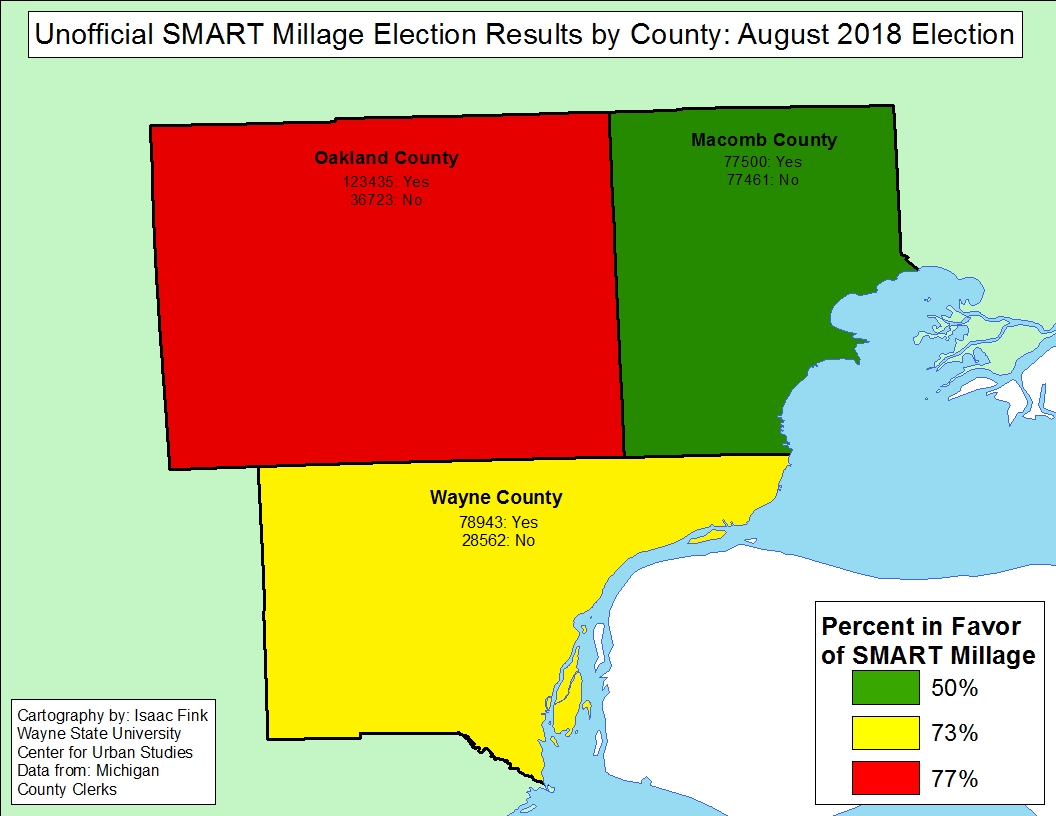
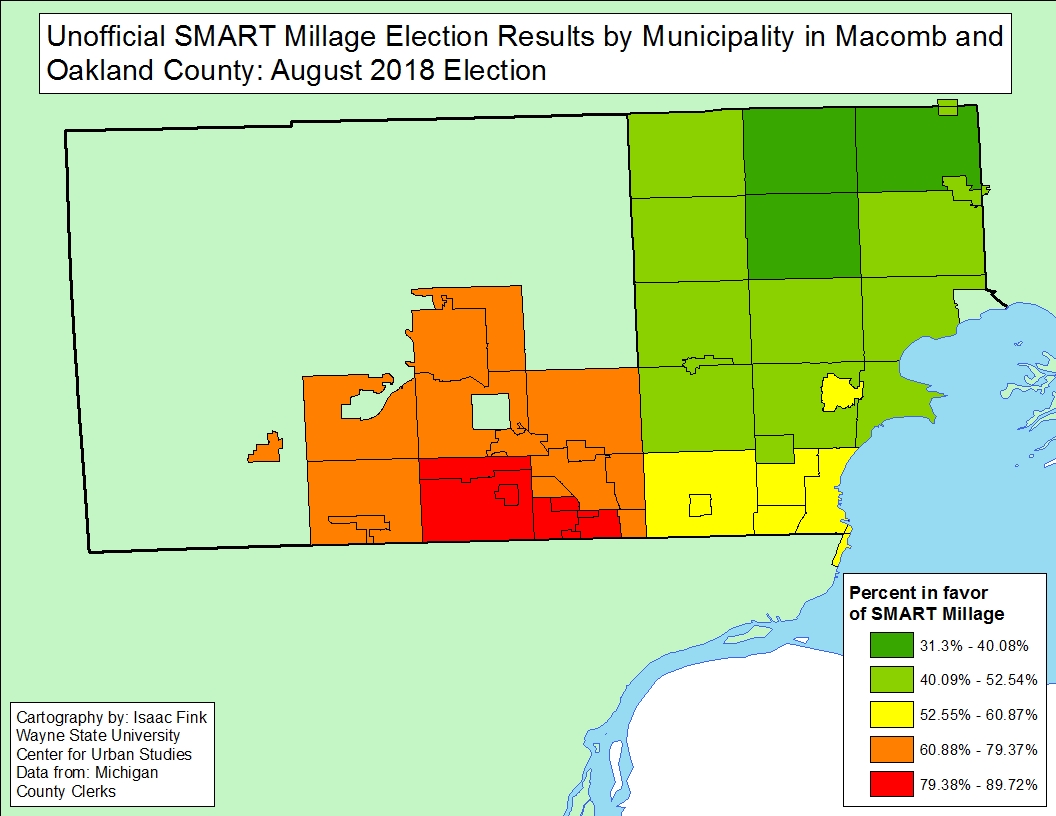
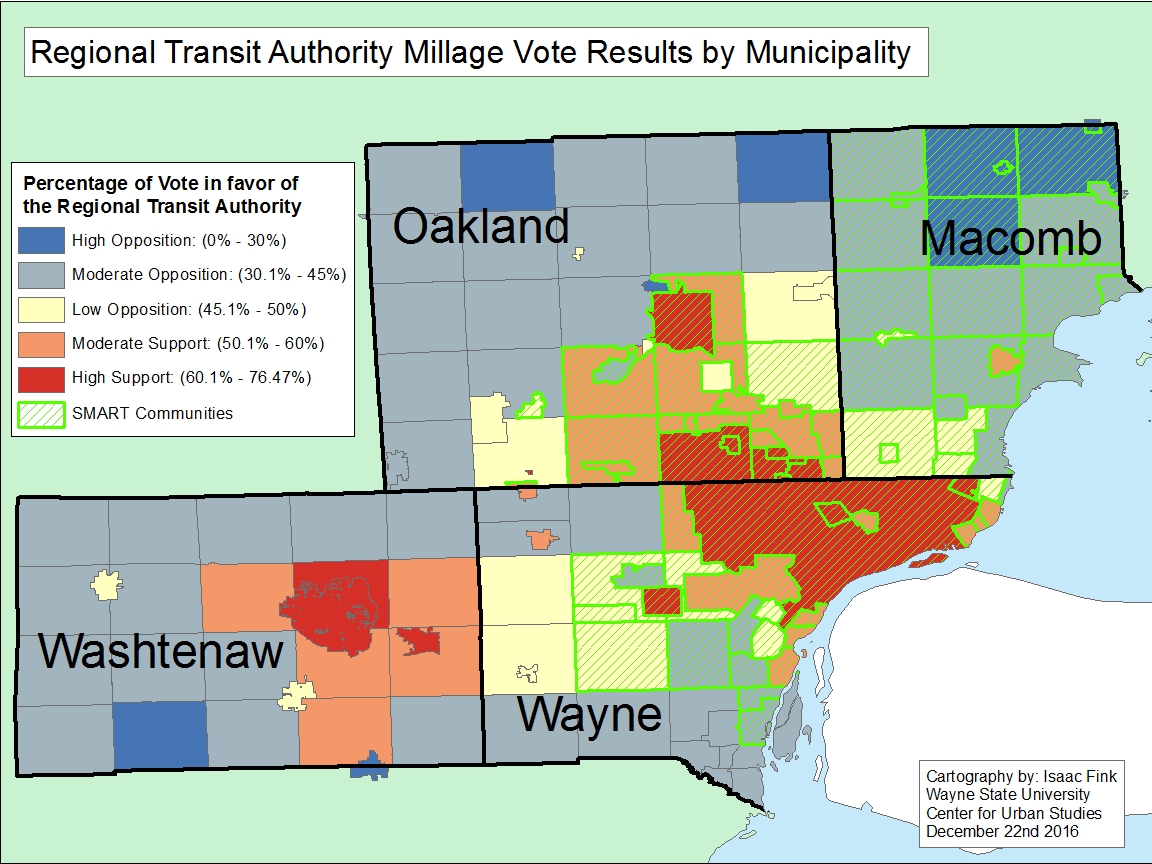
SMART, which is the region’s only existing transportation system outside of the Detroit Department of Transportation’ system, was created in 1967. As is evident by the maps above, the system operates throughout the tri-county region, but not necessarily in every community. Due to the way SMART initiatives can be placed on the county ballots (by individual counties), Macomb County is the only county in which the entire county (50 percent or more) must support a SMART millage in order for it to approved. This is why such a close approval rate for the Aug. 7 millage, and the potential of a recall, were vital for Macomb County, it’s either all or nothing. Unlike Macomb County, Oakland and Wayne counties communities have the option to “opt-out” of supporting the authority. In the second map above, data on approval rates for all Macomb County communities is available, and only partial information is available for Oakland County communities. For the Oakland County communities, these are the “opt-in” communities that approved the SMART proposal.


No data was available for the Wayne County communities through the Wayne County Election’s Office website; the only information available was the pass/fail rate for the millage proposal for the whole county.

In Macomb County, the cities of Grosse Pointe Shores and Eastpointe had the highest passage rates at 61 percent. Ray Township had the lowest approval rate at 31 percent, according to the results. As noted, all the Oakland County communities on the second map above had approval rates above 50 percent, because they “opted in” to use the SMART service. Of those communities, Huntington Woods had the highest approval rate at 90 percent and Walled Lake had the lowest at 70 percent.

While SMART continues to be the only regional transit authority in Southeastern Michigan, this recent election confirms again that the region has a lot of room to grow in providing equal and equitable transportation services throughout the region. If Macomb County voters did not pass the millage request, public transportation in the county would likely have ceased to exist. And, in many parts throughout Oakland and Wayne counties transportation gaps are huge.


Pedestrian Deaths Out Number Cyclist Deaths in Southeastern Michigan

In 2017 there were more vehicle related crashes and fatalities involving pedestrians than there were ones involving bicycles in Southeastern Michigan. According to the data from the Michigan Department of Transportation, there were 1,226 crashes involving pedestrians in Southeastern Michigan in 2017 and 84 pedestrian fatalities. Regionally, Wayne County had the highest total number of pedestrian related crashes at 688. Oakland County had the second highest total number of pedestrian crashes at 213. Of the seven counties in the region, Wayne, Oakland, Washtenaw and Macomb counties all had more than 100 involved pedestrian related crashes. Livingston County had the lowest number of pedestrian crashes at 17.

Just as Wayne County had the highest number of pedestrian crashes, it also had the highest number of pedestrian fatalities. In total, there were 38 pedestrian fatalities in Wayne County in 2017. Regionally, there were 84 pedestrian fatalities in 2017 and St. Clair County had the lowest at two. The map below shows the range of pedestrian accidents by color and presents the number of fatalities next to the county label.

The Detroit map below shows the total number of pedestrian crashes by city block in 2016. This data was provided by the Detroit Open Data portal. The block with the highest number of pedestrian crashes is on the Eight Mile border on the more eastern side of the City. However, you will see the highest concentration of pedestrian crashes was located in the downtown up through Midtown area.

Just as Wayne County had the highest number of pedestrian crashes, it also had the highest number of pedestrian fatalities. In total, there were 38 pedestrian fatalities in Wayne County in 2017. Regionally, there were 84 pedestrian fatalities in 2017 and St. Clair County had the lowest at two.

In 2017 there were 914 bicycle related crashes, with Wayne County having the highest total at 428. Wayne, Oakland and Macomb counties were the only three counties in the region with more than 100 bicycle related crashes. Livingston County had the lowest total at 19. When examining the total number of bicycle related fatalities there were five in the region, with Macomb County having the highest total at two.

While fatalities for cyclists were lower than pedestrian fatalities, in recent years there has been an increase, according to an MLive analysis of fatality numbers. While no specific reason for the increase has been identified, cyclists are encouraged to yield at appropriate intersections, wear bright clothing and utilize bike lanes when possible. Additionally, motorists are also expected to pay attention and provide appropriate distance between their vehicle and a cyclist.

How Detroit is Tackling Rental Code Enforcement, Lead Remediation

The City of Detroit recognizes that lead poisoning prevention is multi-faceted, which is why an Interagency Lead Poisoning Prevention Task Force was created earlier this year, the same time the codes rental properties in the City were tightened. The task force will eventually align future rental code enforcement target ZIP codes with the zip codes where there is a high prevalence of elevated blood lead levels in children. Currently though, the rental code compliance program overseen by the Buildings, Safety, Engineering and Environmental Department (BSEED) is focusing zip codes that do not have among the highest percentage of children 6 years of age and younger with lead poisoning.

The zip codes BSEED is currently enforcing compliance on are: 48215, 48224, 48223, 48219, 48209 and 48210. These six zip codes are the first priorities of the City’s new, stricter rental code ordinance that seeks to ensure all rental properties are properly registered, up to code and have obtained a certificate of compliance. One aspect of the new ordinance is that all rental properties, despite the length of their certificate of occupation, must have annual lead hazard inspections. According to the ordinance, the annual assessment can be waived only if the property owner has taken more long term or permanent measures to abate the lead.


While this ordinance does make lead assessments and abatements a priority for all rental properties, the zip codes identified to have among the highest percentage of children 6 years of age and younger are not included on the initial and current compliance schedule, which is available here (link to BSEED). According to the City of Detroit, the 48210 zip code is to be launched into the new compliance program on Aug. 1, 2018 and is scheduled to have all rental properties in compliance with the new ordinance by Feb 1, 2019. This is certainly a step in the right direction, however, the zip codes with among highest percentage of children with lead poisoning have yet to be placed on the compliance list. The City of Detroit does state though that all rental properties in the City must be in compliance with the new ordinance by the end of 2020.


The zip codes where recent data shows there is the highest prevalence of elevated blood lead levels in Detroit’s children are: 48202, 48204, 48206, 48213 and 48214. According to the City of Detroit Health Department, these zip codes will be included in the new rental property compliance program, but all also be part of the Lead Poisoning Prevention Pilot Program, which is being spearheaded by the Interagency Lead Poisoning Prevention Task Force. As part of this pilot program, there will be door-to-door outreach in the identified zip codes. This outreach will provide occupants, particularly those with children or who are pregnant, with information on how to identify potential lead hazards and protect themselves from the risks. Lead testing will also be provided through this program.

As the information above shows, the City of Detroit has taken steps through both rental code enforcement and direct outreach facilitated through the Health Department. However, direct coordination between the initial enforcement phase of the new rental property compliance ordinance and the Interagency Lead Poisoning Prevention Task Force has yet to fully materialize. The map below highlights just this. The zip codes in red are the ones the City has identified as having the prevalence of elevated blood lead levels in children. The zip codes in blue are the ones that have been identified for the most immediate rounds of registration and compliance for the new rental code.

The information provided in the map below is from the City of Detroit’s website.

Commute Times in Southeastern Michigan Slightly Increase


In all Southeastern Michigan communities more than 70 percent of residents with a job commuted to work by some mode of transportation, whether it be by vehicle or a mode of public transportation in 2016, according to U.S. Census data. In our sprawling region, where cars are king, suburban life has long dominated and road infrastructure is failing, it is no surprise that the average commute time for the region is 30 minutes. However, in 61 of the region’s communities more than 50 percent of commuters experienced a commute time above 30 minutes in 2016.

At the level of counties, Livingston County had the longest average commute time in 2016 at 32 minutes, followed by St. Clair County at 29 minutes. When considering individual communities, there were only three communities where the average commute time was above 40 minutes; these communities were: Berlin Township (40 minutes), Riley Township (41 minutes) and Emmett Township (41 minutes). All three of these communities are located in the more rural areas of the region.

As noted, the data for 2016 shows that 61 communities in Southeastern Michigan have more than 50 percent of commuters experiencing a commute above 30 minutes. Unadilla Township had the highest percent of residents experiencing more than a 30 minute commute at 75; the average commute time for residents in that township was 39 minutes. No city had an average commute time below 20 minutes, and the communities with the lowest commute times either had large employment hubs or were located very close to them. For example, in 2016 commuters in Ann Arbor had the lowest commute time at 20 minutes. Both the University of Michigan and University of Michigan Health Care System are located in Ann Arbor, a relatively compact city.

Between 2010 and 2016 the average percent of residents who commuted to work increased only slightly, by 0.3 percent. While this shows that the number of commuters on the road remained relatively the same between 2010 and 2016, other data shows that, arguably, congestion on the roads have increased. According to the data, the average commute time for residents in Southeastern Michigan increased by about two minutes.

There were 30 communities in the region though where the commute time increased by more than 10 minutes. Overall, there were 127 communities that experienced a percent change increase in average commute times between 2010 and 2016. The communities with the largest percent increase in average commute times between 2010 and 2016 were spread across the region, which could very well mean road congestion was increasing due to the region’s road system. For example, the City of Northville had the largest percent change increase in commute time between 2010 and 2016 at 31 percent. Northville is located near to I-275, I-696 and I-96 in the areas where these highways are often under construction and experience regular traffic backups due to congestion.

River Rouge had the second largest increase at 26 percent. Jefferson Avenue runs through River Rouge, but was not easily accessible in the city between 2013 and 2016 due to the Jefferson Bridge being closed. This traffic shift would have caused commuters in River Rouge, and other downriver communities, to have to utilize Fort Street and/or I-75 to commute, meaning there were additional vehicles on these alternate routes.

On the opposite side of the spectrum, there were 78 communities in the region where average commute times decreased between 2010 and 2016. Of those communities, 14 had a decrease in the average commute time by more than 10 minutes.

While construction and constricted road systems attribute to traffic congestion, so does the number of vehicles on the road. In Southeastern Michigan we know that there is no comprehensive regional transit system, and instead majority of commuters rely on driving themselves to and from work. A way to decrease traffic congestion is to create a reliable, connected regional transit system that residents would be able to utilize to get to and from work. Increased use in public transportation would decrease congestion, particularly at peak hours, and put less stress on our existing road infrastructure.

Monroe’s Water Lead Levels Highest in Southeastern Michigan

In 1991 the Lead and Copper Rule was implemented by U.S. Environmental Protection Agency as a means to help prevent exposure to lead and copper. According to the rule, if lead concentrations in drinking water exceed 15 parts per billion (ppb) in more than 10 percent of customer’s taps sampled, additional controls must be taken to prevent corrosion. According to a recent MLive article, which compiled Michigan Department of Environmental Quality lead testing data from water systems throughout the State of Michigan, the City of Monroe was the only public water system in Southeastern Michigan that had lead levels that reached the federal threshold. According to the data, which states testing ended on Dec. 31, 2016, the City of Monroe’s 90th percentile for lead was 15 ppb. For comparison, the data showed that between January and June of 2017 Flint’s 90th percentile for lead was 7 ppb.

In Southeastern Michigan, there were only three public water systems (for which data was available) with lead concentration levels above Flint’s. Those systems were located in:

  • Grosse Pointe Shores: 9 ppb
  • Capac: 7ppb
  • Marysville: 12 ppb

Conversely, there were 77 public water systems in Southeastern Michigan for which data was available, with zero lead tested in the water system.

While the data shows the lead levels are improving in Flint, this data also shows how the region’s, and the state’s, water systems need continuous monitoring and the infrastructure needs regular maintenance. According to a Brookings article (link), the federal government is only responsible for less than a quarter of the spending on all 51,000 plus public water systems in the country. This means, local and state governments must bare the brunt of the cost to ensure citizens have access to a clean, reliable water source. In Southeastern Michigan, a large portion of the region’s water system is overseen by the Great Lakes Water Authority. This government agency is regional authority that was created to ensure larger purchasing power is available for infrastructure improvements. This is one step the region has taken in recent years to ensure clean water remains available to the residents of Southeastern Michigan.

Wayne County Home to Region’s Oldest Homes

The majority of Southeastern Michigan’s oldest homes are located in Wayne County, with six of the communities in the county having more of than 50 percent of the housing stock built prior to 1950. These communities are: Detroit, Highland Park, Hamtramck, Grosse Pointe Farms, Grosse Pointe Park and Wyandotte. Of those communities, and regionally, Grosse Point Park had the highest percentage of homes built before 1950 at 77 percent, followed by Hamtramck at 70.4 percent. In Detroit, about 58 percent of the city’s housing stock was built before 1950. Majority of the homes in Detroit built before 1950 are located in Southwest Detroit, with pockets near the Highland Park and Hamtramck borders, or the central area of the city. Conversely, the area long Belle Isle/the West Village and the most northwest corner of Detroit have the lowest percentage of homes built prior to 1950.

Regionally, about 22 percent of Southeastern Michigan’s housing stock was built prior to 1950. Looking a decade ahead, Census data shows that about 41 percent of the region’s housing stock was built before 1960. In examining this map below, we see that the communities with the highest percentage of homes built before 1960 mainly grew around the city of Detroit into the southern borders of Macomb and Oakland counties, and just east of Detroit. Southern Macomb County experienced some of the largest growth between 1950 and 1959, according to the Census Data. During that time frame Eastpointe grew its housing stock by 48 percent, bringing the total percentage of homes built prior to 1960 to about 78 percent. The City of St. Clair Shores grew its housing stock by 51 percent between 1950 and 1959; the total percentage of this city’s housing stock built prior to 1960 is 66 percent. In Oakland County, the City of Oak Park grew its housing stock by 51.2 percent between 1950 and 1959, growing the percentage of its housing stock built prior to 1960 to 67 percent.

While the inner-ring Detroit suburbs began to grow during this time, the peak percentage of homes being built after 1950 was for cities like Detroit, Hamtramck and Grosse Pointe Farms. For the city of Hamtramck, majority of its housing stock was built before 1939; the same is true for the city of Grosse Pointe Farms.

In Detroit, 22.9 percent of its housing stock was built between 1950 and 1959, making about 80 percent of its housing stock being built before 1960. The decade in which plurality of Detroit’s housing stock was built was between 1940 and 1949; about 24 percent of the housing stock was built during the 1940s.

As noted, the percentage of homes built outside the city of Detroit truly began to ramp up after 1950; the Detroit map below shows a similar trend was also occurring in the city. In the 1950 Detroit map above the Census data shows that majority of the housing built in Detroit prior to 1950 was located in the southwest portion area of the city and the more central area. The 1960 map shows that the percentage of housing built in Detroit between 1950 and 1959 largely grew in the northern and northwestern parts of the City.

This post highlights that Detroit and its inner-ring suburbs have a large stock of aging homes that will require investments and stronger laws to remain safe and habitable. One recent example of this is how the Detroit City Council approved updating its property maintenance code. This code amendment now requires landlords to remove lead hazards from homes that they rent. Such actions are particularly important because, because homes built prior 1978 are particularly susceptible to hazards related to lead-based paint given that a ban didn’t exist until then.

Wayne County Top in the Region for Injury, Crash Rates for Pedestrian and Bicycle-Vehicle Crashes

This post presents the rate of injuries and fatalities for vehicle crashes involving pedestrians and bicycles in all counties throughout Southeastern Michigan in 2015, according to the Michigan State Police. The rates in this post were calculated per 100,000 residents.

Wayne County had the highest injury and total crash rates for both pedestrian-vehicle crashes and bicycle-vehicle crashes. In total, Wayne County had a pedestrian-vehicle injury rate of 37 and a total pedestrian-vehicle crash rate of 42. These rates represent a total of 667 pedestrian-vehicle injuries in 2015 in Wayne County and 749 total pedestrian-vehicle crashes in Wayne County in 2015, according to the Michigan State Police. When examining the rate for pedestrian-vehicle fatalities, Macomb County had the highest rate in the seven county region at 9. In Macomb County in 2015 there were a total of 15 fatalities involving a pedestrian and a vehicle. Wayne County had a total of 72 fatalities from the same type of vehicle accident; this was equivalent to a rate of 4. Livingston County had the lowest rate of fatalities and injuries, with rates of 0.5 and 9, respectively.

Slide03

Slide04

Slide05

As noted earlier, Wayne County had the highest bicycle-vehicle injury rate in the region at 18.9 per 100,000 residents, with Washtenaw County only slightly behind at 18.4. When looking at the raw data though, there was a total of 336 bicycle-vehicle crashes in Wayne County, there was 72 in Washtenaw County. Monroe County had the highest bicycle-vehicle fatality rate at 1.3 per 100,000 residents with a total of 2 fatalities caused by such accidents in 2015. Washtenaw County came in just below Monroe County with a rate of 1.1 with a total of 4 bicycle-vehicle fatalities; there were also 4 bicycle-vehicle crash related fatalities in Oakland County in 2015 with a rate of 0.3. Livingston and St. Clair counties had zero related bicycle-vehicle related fatalities.

For the total crash bicycle-vehicle crash rates, Wayne County had the highest at 25 per 100,000 residents, with a total of 449 crashes. Livingston County had the lowest rate at 3 with a total of 6 bicycle-vehicle crashes.

Slide07 Slide08 Slide09

According to Smart Growth America, the Metro-Detroit area is ranked 17th of 104 nationwide metropolitan areas for most dangerous areas for pedestrians, due to the number of pedestrian deaths in the region between 2005-14. This study cited street design as one of the reasons for the total number of deaths. Additionally, the Macomb Daily recently cited distracted driving as a reason for the increased number of vehicle related fatalities, including pedestrian and bicycle related ones, over the last several years. This article said distracted driving included cell phone use and being under the influence of drugs and alcohol.

Where Did the RTA Fail in Southeastern Michigan?

In November 2016 the concept of regional transportation in Southeastern Michigan lost again. On the Nov. 8 ballot was a question asking residents of Macomb, Oakland Wayne (including Detroit) and Washtenaw counties if they would fund a 1.2 mill tax (about $120 a year for a homes with a taxable value of $100,000) for 20 years.

If passed, the millage would have created main transportation routes along Woodward, Gratiot and Michigan avenues (some of which would have eventually used Bus Rapid Transit), along with connector lines going east to west throughout Wayne, Oakland, Macomb and Washtenaw counties. However, only Wayne and Washtenaw counties supported the millage overall. In Oakland County the millage fell short of approval by 1,109 votes (50.1 percent of voters voted against it) and in Macomb County the measure failed with 60 percent of voters voting against it.

Slide2

Currently in Southeastern Michigan, public transportation is fragmented, at best. Parts of Wayne, Oakland and Macomb counties are serviced by the Suburban Mobility Authority of Regional Transit (SMART), a transportation system that was created in 1967. However, in Oakland and Wayne counties communities can opt-out of the system, meaning they do not need to support its funding or have routes accessible in their community. Macomb County, through legislation passed by the County Board of Commissioners, is an entirely opt-in community. This means either the majority of the county supports SMART funding when it goes up for renewal and/or increases or it doesn’t; the county as a whole has historically supported SMART.

RTA Vote - Municipality Level - SMART Communities_Borders&Labels_JPEG

Despite Macomb County being completely opt-in for SMART, only one municipality supported the RTA millage in November; it was Mount Clemens-the county seat. According to the Macomb County Clerk’s Department 55 percent of voters in Mount Clemens supported the millage and 45 percent voted against it.

In Oakland County, 23 of the 51 municipalities in the region supported the RTA millage, with the inner-ring suburbs like Ferndale (72% yes), Pleasant Ridge (74% yes) and Huntington Woods (76% percent yes) showing the highest support. Unlike Macomb County, Oakland County is not an entirely “opt-in” community for SMART, meaning individual municipalities decide whether they want to fund/participate in the region’s current form of public transportation. Ferndale, Pleasant Ridge and Huntington Woods all opt-into SMART, as do some of the Oakland County communities that were just above 50 percent of voters supporting the RTA millage; these communities include Bloomfield Township and Birmingham. Troy and Bloomfield Hills are two communities in Oakland County though that participate in SMART but did not approve the RTA millage.

In Wayne County, where there are SMART routes and where the Detroit Department of Transportation (DDOT) operates, communities like Detroit, Hamtramck, Highland Park, Dearborn and Redford Township (which all participate in SMART) voted to approve the RTA millage. However, communities on the western side of the county and a majority of the downriver communities (despite some participating in SMART-like Trenton) did not approve of the transportation millage. Overall, 53 percent of Wayne County voters voted to approve the RTA millage.

Washtenaw County does not participate in SMART (the transit system is limited to Macomb, Oakland and Wayne counties) but it does have the Ann Arbor Transit Authority (AATA). Of those who voted on this measure, 53 percent supported the millage in the county. Overall, eight of the 27 communities in the county supported the millage. However, those with the highest populations (Ann Arbor and Ypsilanti) showed high support for the regional transportation tax.

Despite not having a long-term funding mechanism, the RTA currently operates RefleX, which is a supplemental ride system along Woodward and Gratiot avenues; these services did not eliminate any SMART or DDOT stops/lines. However, the RTA is only funded by the State through Sept. 30, 2017. After that though, its future is uncertain. With the regional transportation millage failing, the RTA is left without a solid funding source and cannot go to the voters with another tax proposal until 2018. According to Public Act 387 of 2012 (which created the RTA), the RTA can receive money through voter approved millage funding and/or an additional fee that may accompany state driver registration fees. Ballot initiatives can only be placed on ballots during presidential or gubernatorial elections.

Members of the RTA Board of Directors or Executive Staff have not publicly stated their future plans or ideas for funding mechanisms. While funding mechanisms would need to be identified, negotiating interlocal agreements between communities that want transit might be an incremental means of supplementing the fragmented systems currently in place. For example, there are no direct public transportation routes between Ann Arbor and Detroit[1] even though Ann Arbor, Detroit and DTW are the most desired routes, according to surveys. Both Wayne and Washtenaw Counties voted for the RTA, so it seems feasible that enterprising public officials in those two counties could negotiate an agreement to move forward on creating services, knowing both that their residents voted for services and that they want those routes.

[1] It might be possible for an ambitious soul to take a bus from Ann Arbor to the Detroit Metropolitan Airport (DTW) and then shift to a SMART bus and transfer to a DDOT bus into Detroit.
[1] It might be possible for an ambitious soul to take a bus from Ann Arbor to the Detroit Metropolitan Airport (DTW) and then shift to a SMART bus and transfer to a DDOT bus into Detroit.

Vacancy Rates in Detroit Remain Stagnant

In the City of Detroit in September 2016 the total percentage of vacancies was 21.9 percent, according to the U.S. Postal Service. This vacancy percentage was nearly unchanged from the 22 percent total vacancy rate the U.S. Postal Service reported in June of 2016. Similarly, when looking at the percentage of residential vacancies and business vacancies in the City these too nearly went unchanged between June and September. The U.S. Postal Service reports that the September 2016 residential vacancy rate was 22.4, down 0.1 percent. The September 2016 business vacancy rate was 25.9, up .02 percent from June.

Overall, in the month of September there were 87,762 reported total vacancies, 80,002 of which were residential, 7,670 of which were businesses and 104 of which were considered “other.” Between June and September, the total 0.1 percent vacancy decrease was equivalent to a decrease of 579 vacant addresses; there was a decrease of 641 vacant residential addresses and an increase of 62 vacant business addresses.

The first two maps below show, by Census Tract, the total number of vacancies and the total percentage of vacancies. The Census Tract with the highest number of total vacancies is on the east side, just north of Belle Isle. This Census Tract had 906 vacancies, which was 50.6 percent of the total number of structures in that Census Tract.

As the first map shows, majority of the Census Tracts with vacancies above 400 were located either on the cities east side, or just west of the downtown area of Detroit. When looking at the total percentage of vacancies in Detroit by Census Tract we see there is a slight shift in which Census Tracts have among the highest amount of vacancies in terms of percentage versus total numbers. This is directly related to the total number of structures in each Census Tract. For example, just east of Hamtramck there is a Census Tract with 229 vacant addresses, a number that does not put in amongst the Census Tracts with the highest vacancy numbers. However, these 229 vacant addresses in that Census Tract mean there is a 42.9 percent vacancy rate. Just south of that Census Tract is another where there are 307 vacancies which make up 18 percent of the structures there.

slide4

slide5

When comparing the total number of vacancies between September 2015 and 2016 we see that there are several Census Tracts that experienced an increase in the total number of vacancies. It was a Census Tract just north of Highland Park that experienced the greatest increase at 7.8 percent. Vacancy increases over the last year occurred the most on the City’s east side, however they were not isolated there.

Overall, while there were Census Tracts with vacancy rate increases there was a total decrease of 5,446 vacant addresses between September 2015 and September 2016.

In addition to these changes, in September of 2016 there was a decline in the number of “no stat” addresses; that number decreased by 2084 in the last year. Mail carriers denote properties as being either “vacant” or “no-stat.” Carriers on urban routes mark a property as vacant once no resident has collected mail for 90 days. Addresses are classified as “no-stat” for a variety of reasons. Addresses in rural areas that appear to be vacant for 90 days are labeled no-stat, as are addresses for properties that are still under construction. Urban addresses are labeled as no-stat when the carrier decides it is unlikely to be occupied again any time soon — meaning that both areas where property is changing to other uses and areas of severe decline may have no-stat addresses.

slide7

Discrepancies Exist Between Detroit Demolitions and Vacancy Rates

Since January 1, 2014 the City of Detroit reports on its Demolition Program webpage that there have been 10,667 demolitions of vacant buildings as part of its blight removal program, as shown in the maps below. These demolitions were made possible through the Detroit Demolition Program, which receives federal funding to aid in the removal of blight. Just last week it was announced the U.S. Department of Treasury released an additional $42 million in funds to support the program. However, that funding, and the program, was suspended from August through just a few weeks ago while the U.S. Department of Treasury and the Michigan State Housing and Development Authority worked to create new guidelines for the demolition program. These guidelines create greater oversight by limiting the number of houses in a bid package, requiring more transparency in what subcontractors are used and having state employees working in the Detroit Land Bank and Building Authority offices, according to the Detroit News.

According to the City of Detroit’s demolition project page, there are 2,459 structures in the demolition pipeline, meaning they are scheduled to be demolished in the near future, and 3,096 that have already been demolished in 2016. The first two maps below show the 10,667 demolitions that have occurred in the City, by Census Tract, since January 1, 2014. The data used to create those two maps was provided from the City of Detroit’s Open Data Portal.

The third map shows vacancies in the City of Detroit, as reported by the U.S. Postal Service.

slide7

slide8

slide6

The first two maps above illustrate how certain areas of the City experience much lower rates of demolition than others. The third map shows what the vacancy rates were in the City of Detroit as of June 2016. In comparing the first two maps with the third we are able to identify discrepancies there are between where demolitions are occurring and where vacancy rates are the highest.

When examining the first two maps we see on the City’s northwest side (in the Evergreen/Rosedale area), within one Census Tract there were 295 demolitions between January 1, 2014 and October 13, 2016. The third map shows that as of June 2016 there was a 35.9 percent vacancy rate in that Census Tract, according to the U.S. Postal Service. There was only one other Census Tract in the City that had more than 200 demolitions. This Census Tract was located in the Cody/Rouge area on the west side of the City. This Census Tract had a vacancy rate of 37.5 percent in June of 2016, according to the U.S. Postal Service.

The Census Tract with the highest vacancy rate in June of 2016 is just east of Groesbeck Avenue (M-97); it had a vacancy rate of 50.3. However, according to the demolition data there have only been 15 demolitions in that Census Tract since January 1, 2014. Overall, this pocket of the City (northeastern area of the City along M-97) had vacancy rates ranging between 38 and 51 percent while the number of demolitions per Census Tract, in general, ranged between 15 and 54. There were exceptions, such as the two neighboring Census Tracts just east of I-94 where the vacancy rates were 33.6 percent and 31.6 percent and the number of demolitions in both areas were among the highest in the City, 147 and 145 respectively.

Areas in the City with among the lowest vacancy and demolition rates are Midtown, Downtown and Corktown. Also, Midtown and Downtown have some of the City’s newest housing units. Other areas in the City with the lowest demolition numbers are located on and around the Woodward Corridor, both north and south of Highland Park. The Palmer Park area, and the neighborhood to the west had several Census Tract where there were less than 10 demolitions in the time frame mapped. This area, in general, also had lower residential vacancy rates in June of 2016, ranging between 6 and 15 percent by Census Tract.

Near the Woodward Corridor though there are three Census Tracts, all of which border Highland Park, that had between 121-200 demolitions with vacancy rates for those three Census Tracts ranging between 20 and 35.

While a great deal of blight removal has already occurred in the City, there is still plenty of work to do. According to the City’s website, the goal is to remove 40,000 blighted properties within an eight year time frame. This post shows certain areas where there have been high rates of demolition in areas with high vacancy rates. However, this post also shows the opposite-Census Tracts with high vacancy rates and low demolition numbers. As the City moves forward with reaching is 40,000 structure demolition goal vacancy rates should continuously be monitored to help determine demolition priorities.