Maternal deaths remain a concern, especially with Michigan’s maternal mortality rate at 16.4 per 100,000 live births in 2018, according to the National Center for Health Statistics, and the United States rate at 17.4 per 100,000 live births. As described in the Surgo Venture Maternal Vulnerability Index (MVI), there are many factors that contribute to maternal mortality rates including, but not limited to, accessibility, affordability and utilization of healthcare.
Health insurance plays an important role in a woman’s pregnancy, allowing for both the mother and unborn child to receive necessary care to ensure each individual remains healthy through regular checkups and addressing any issues that may be identified during the pregnancy.
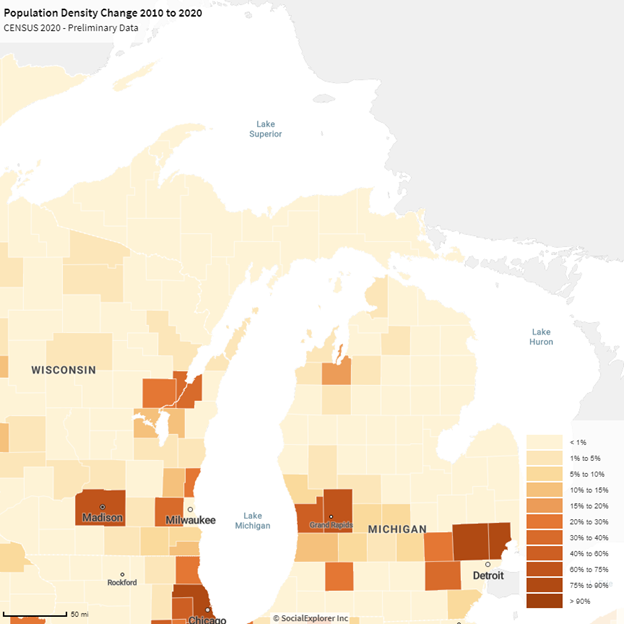
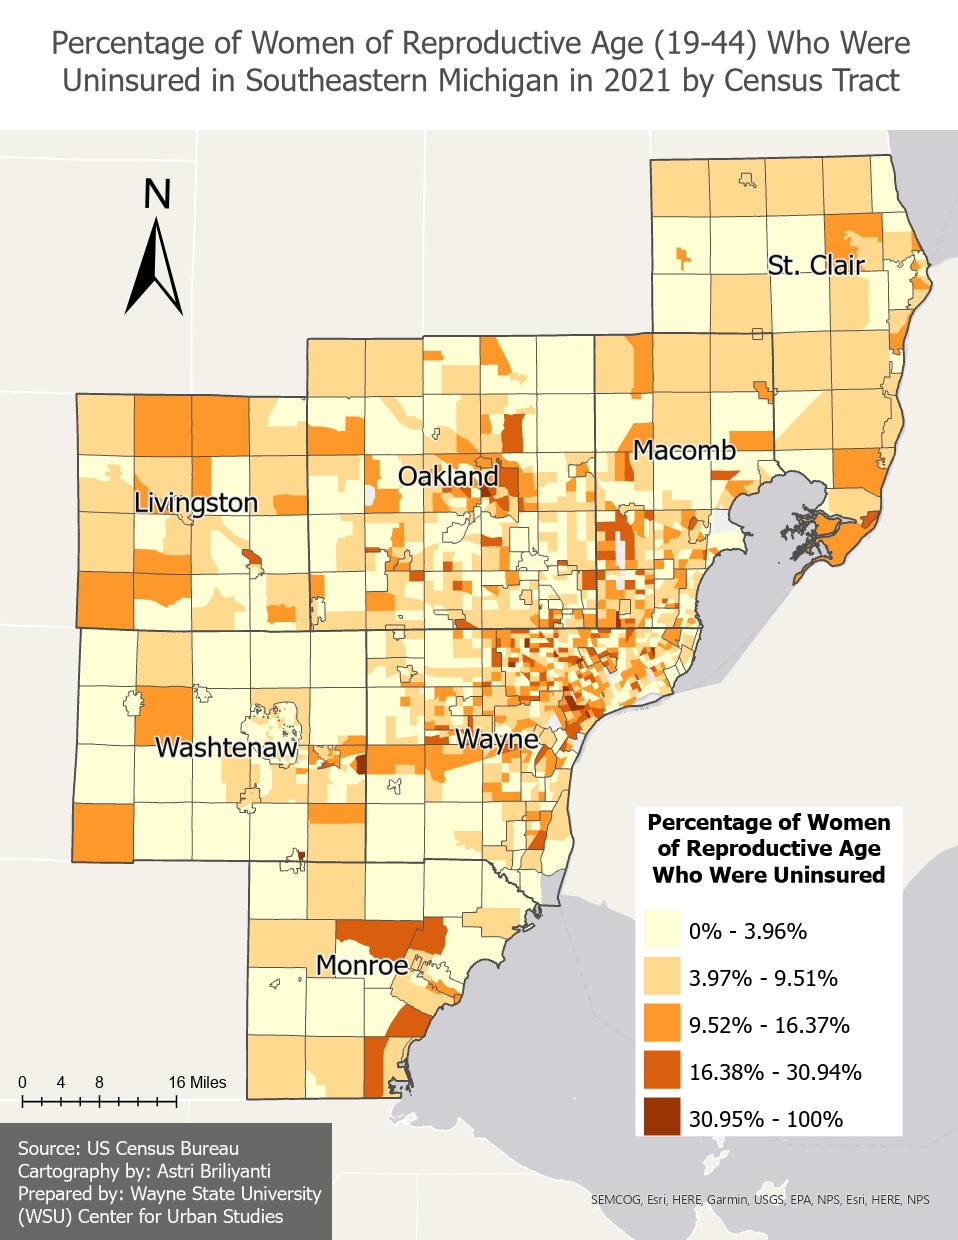
Wayne County has the highest percentage of women of childbearing age (19-44) who were uninsured at 7.8 percent, followed by Macomb County where 7.5 percent of women of childbearing age are uninsured. In Wayne County 203 of the 610 Census Tracts have 10 percent or more of women of childbearing age without health insurance and in Macomb County that number is 57 of the 217 Census Tracts. As the second map below shows, the Census Tracts with the highest percentage of women of childbearing age without health insurance are in Wayne County, with additional pockets in Macomb and Monroe counties, where more than 16 percent of women of childbearing age in a Census Tract are without health insurance.
Washtenaw County has the lowest percentage of women of childbearing age without health insurance at 4.6 percent.
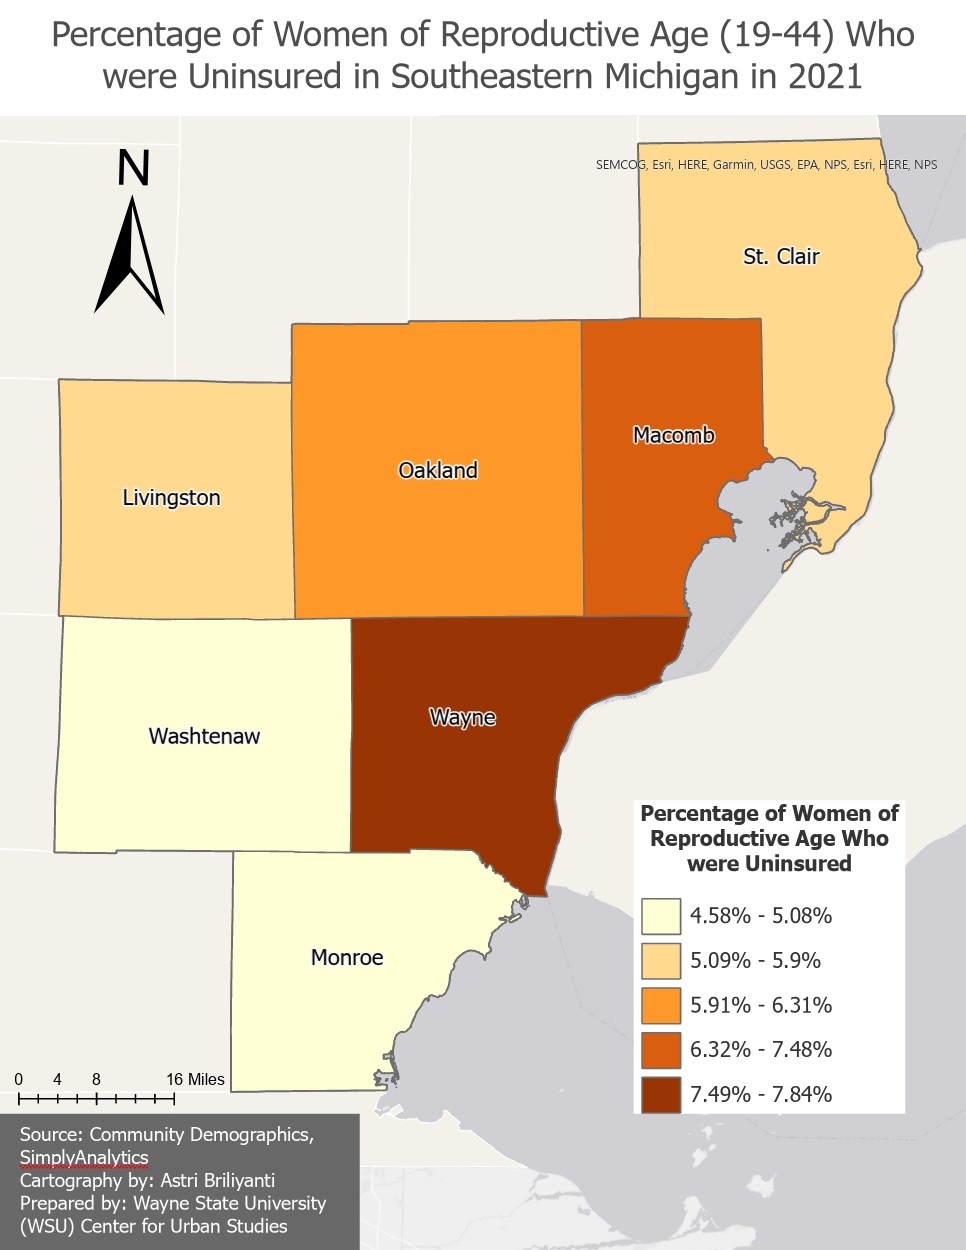
As noted, this data set plays a role in determining where a county or state falls in the General Healthcare Sub-Index of the MVI, which is one of six sub-categories that explores the factors that impact maternal mortality rates and maternal health in general. In Southeastern Michigan, St. Clair County has the highest vulnerability index at 45 while Washtenaw County has an index of 0, meaning there is ease in access to and affordability of healthcare for reproductive age women. Michigan has a General Healthcare Sub-Index of 29.
The fact that Washtenaw County has the lowest percentage of women of childbearing age without health insurance explains, in part, why it also has the lowest General Healthcare Sub-Index of the MVI. However, St. Clair County has the highest General Healthcare Sub-Index of the MVI in Southeastern Michigan but has the fourth lowest percentage of women of childbearing age without health insurance in the region (5.1 percent).
So, while access to and utilization of healthcare is a vital aspect in keeping maternal deaths low, it certainly is not the only factor. Other factors include mental health, substance use, socioeconomic status, education levels and more. We will further dig into these factors to see what factors impact the areas of Southeastern Michigan the most.